
- LIVE QUOTES
- LEARN
- HELP
 Wall Street Journal
EN
Global's June 2025 Stocks That May Be Priced Below Intrinsic Value
As global markets navigate a mixed economic landscape, with U.S. stocks rising amid cooling labor market conditions and ongoing trade discussions between major economies, investors are keenly observing sectors like information technology that have shown resilience. In such an environment, identifying stocks that may be undervalued involves assessing their intrinsic value against current market prices, considering factors like earnings potential and sector performance.
Top 10 Undervalued Stocks Based On Cash Flows
| Name | Current Price | Fair Value (Est) | Discount (Est) |
| Taiwan Union Technology (TPEX:6274) | NT$211.50 | NT$422.89 | 50% |
| Range Intelligent Computing Technology Group (SZSE:300442) | CN¥43.20 | CN¥85.89 | 49.7% |
| Peijia Medical (SEHK:9996) | HK$6.39 | HK$12.67 | 49.6% |
| Guangdong Zhongsheng Pharmaceutical (SZSE:002317) | CN¥15.68 | CN¥31.12 | 49.6% |
| Food & Life Companies (TSE:3563) | ¥6599.00 | ¥13055.25 | 49.5% |
| Ficont Industry (Beijing) (SHSE:605305) | CN¥26.28 | CN¥52.38 | 49.8% |
| doValue (BIT:DOV) | €2.212 | €4.41 | 49.9% |
| Dive (TSE:151A) | ¥917.00 | ¥1828.78 | 49.9% |
| Airbus (ENXTPA:AIR) | €162.80 | €324.82 | 49.9% |
| Absolent Air Care Group (OM:ABSO) | SEK210.00 | SEK415.92 | 49.5% |
Let's explore several standout options from the results in the screener.
Vista Energy. de (BMV:VISTA A)
Overview: Vista Energy, S.A.B. de C.V., operates in the exploration and production of oil and gas across Latin America, with a market capitalization of MX$104.13 billion.
Operations: The company generates revenue of $1.77 billion from its exploration and production activities in crude oil, natural gas, and LPG across Latin America.
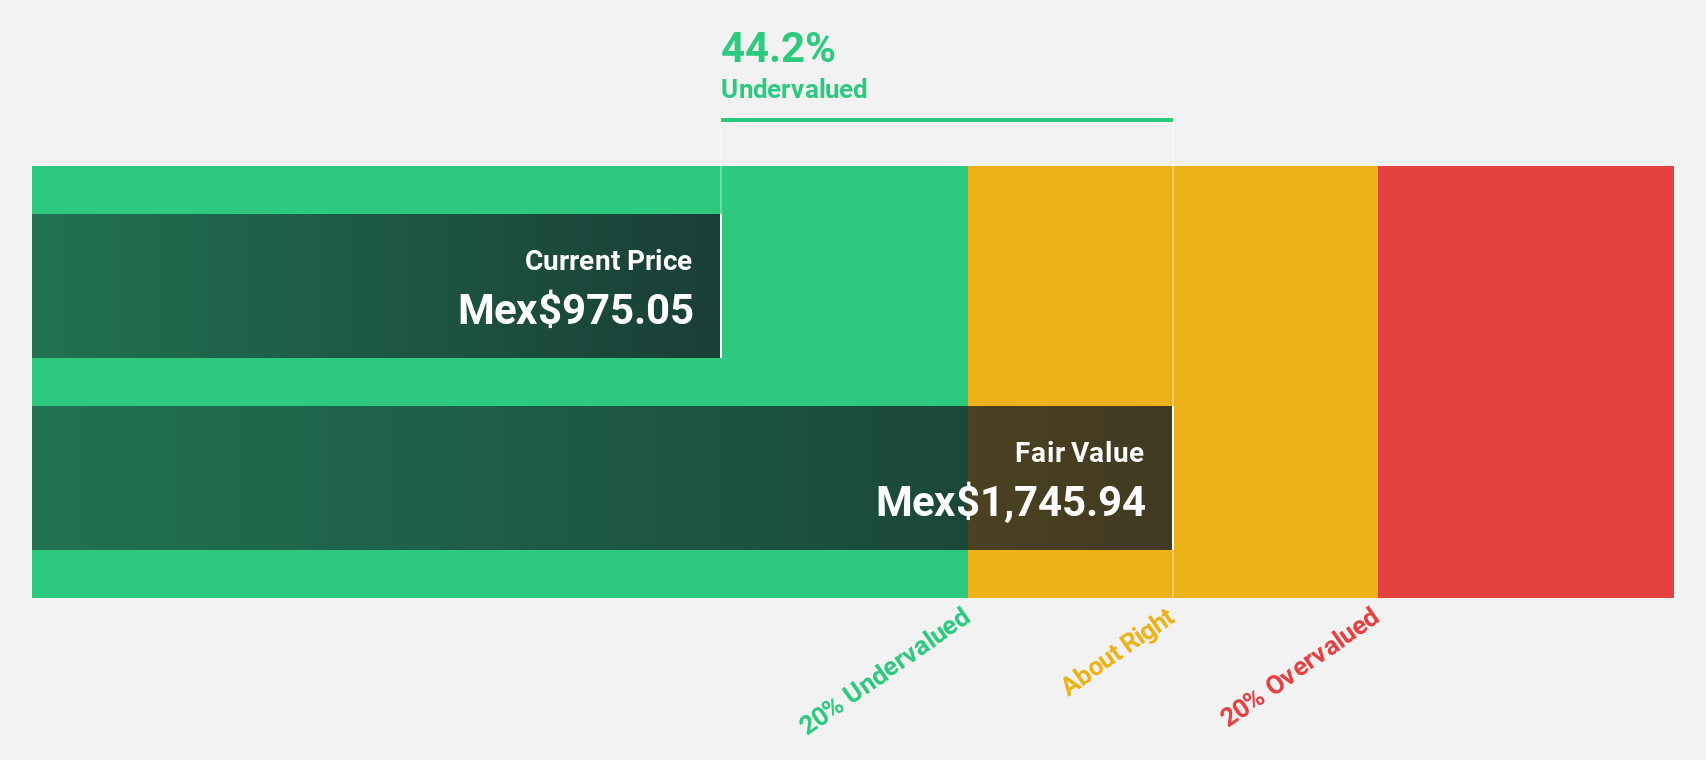
Estimated Discount To Fair Value: 43.3%
Vista Energy, S.A.B. de C.V. appears undervalued based on its discounted cash flow valuation, trading at MX$987.47 while estimated fair value is MX$1743.05, indicating a significant margin below fair value by over 20%. Despite high debt levels and recent share price volatility, earnings are projected to grow faster than the market at 18% annually. Recent production results showed a substantial increase with oil production up by 47%, supporting strong revenue growth expectations of 16.4% per year above the market average.
- According our earnings growth report, there's an indication that Vista Energy. de might be ready to expand.
- Click to explore a detailed breakdown of our findings in Vista Energy. de's balance sheet health report.
NHN (KOSE:A181710)
Overview: NHN Corporation is an IT company offering gaming, payment, entertainment, IT, and advertisement solutions both in South Korea and internationally with a market cap of ₩793.61 billion.
Operations: The company's revenue is primarily derived from its Payment and Advertising segment, which accounts for ₩1.19 billion, followed by the Games segment contributing ₩462.92 million.
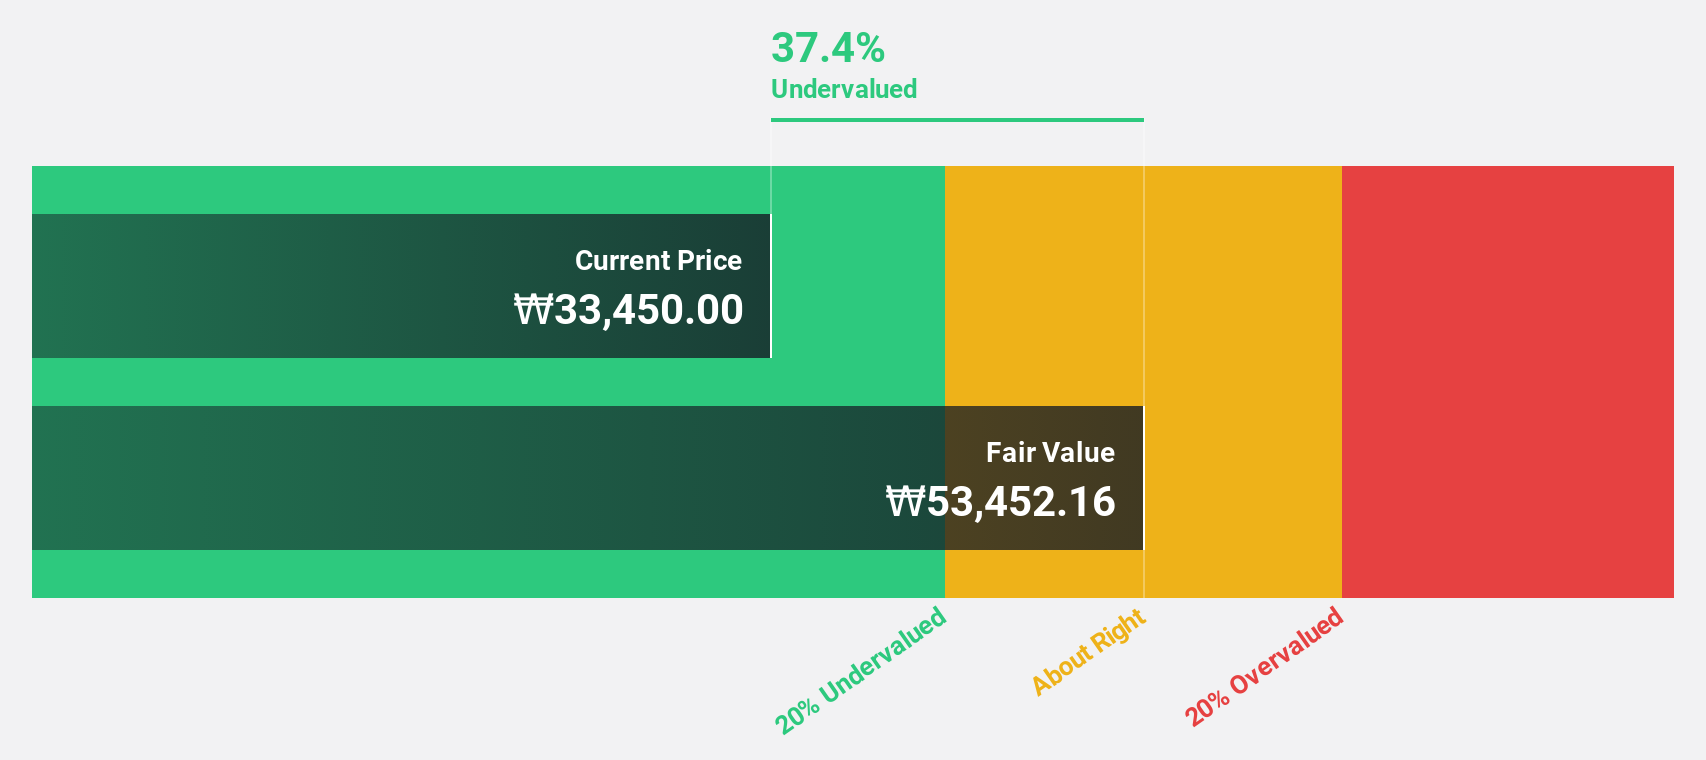
Estimated Discount To Fair Value: 44.5%
NHN is trading at ₩28,400, significantly below its estimated fair value of ₩51,206.62. Despite a net loss in Q1 2025 and a dividend yield of 1.76% not covered by earnings, the company is expected to become profitable within three years with above-market growth rates. Recent strategic initiatives include a share buyback program enhancing shareholder value and the launch of DarkEST DAYS game globally, potentially driving future revenue growth amidst slower current revenue increases.
- Our expertly prepared growth report on NHN implies its future financial outlook may be stronger than recent results.
- Click here and access our complete balance sheet health report to understand the dynamics of NHN.
Kadokawa (TSE:9468)
Overview: Kadokawa Corporation operates as an entertainment company in Japan with a market cap of approximately ¥542.23 billion.
Operations: Kadokawa Corporation generates revenue primarily from its Publication/IP Creation segment at ¥151.37 billion, followed by Animation/Film at ¥51.09 billion, Gaming at ¥33.60 billion, Web Service at ¥18.04 billion, and Education/Edtech contributing ¥15.12 billion.
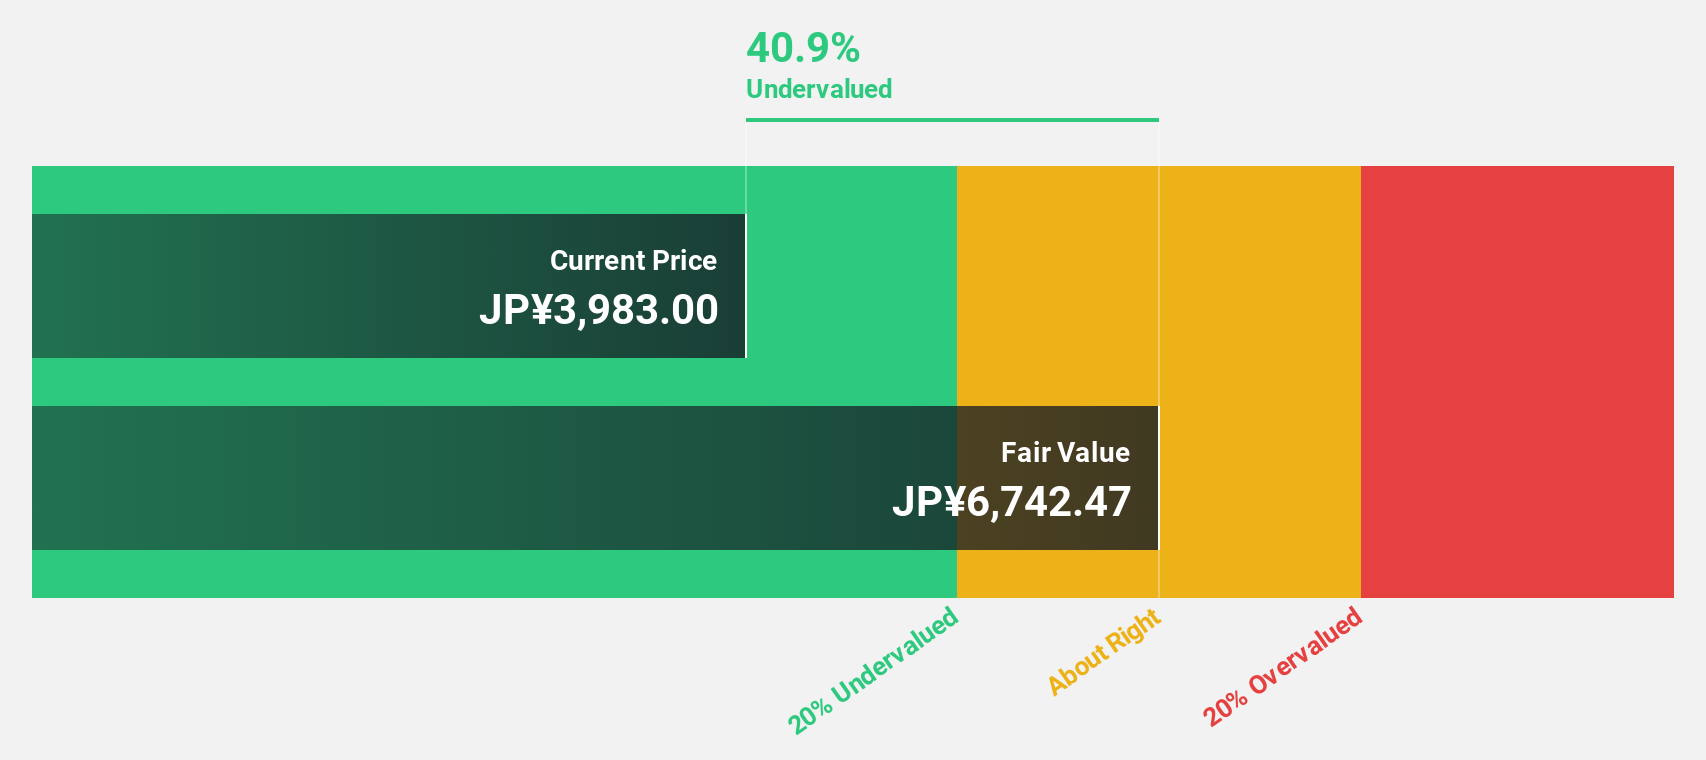
Estimated Discount To Fair Value: 25.3%
Kadokawa is trading at ¥3,819, below its estimated fair value of ¥5,114.59. Despite a recent decline in profit margins from 4.4% to 2.7%, earnings are projected to grow significantly at 21.39% annually, outpacing the JP market's growth rate of 7.5%. The company's strategic partnership with NHN for a globally targeted game based on the popular anime 'OSHI NO KO' could enhance revenue streams despite expected slower revenue growth of 5.9% per year compared to earnings growth.
- In light of our recent growth report, it seems possible that Kadokawa's financial performance will exceed current levels.
- Get an in-depth perspective on Kadokawa's balance sheet by reading our health report here.
Make It Happen
- Explore the 495 names from our Undervalued Global Stocks Based On Cash Flows screener here.
- Have a stake in these businesses? Integrate your holdings into Simply Wall St's portfolio for notifications and detailed stock reports.
- Join a community of smart investors by using Simply Wall St. It's free and delivers expert-level analysis on worldwide markets.
Curious About Other Options?
- Explore high-performing small cap companies that haven't yet garnered significant analyst attention.
- Diversify your portfolio with solid dividend payers offering reliable income streams to weather potential market turbulence.
- Fuel your portfolio with companies showing strong growth potential, backed by optimistic outlooks both from analysts and management.
This article by Simply Wall St is general in nature. We provide commentary based on historical data and analyst forecasts only using an unbiased methodology and our articles are not intended to be financial advice. It does not constitute a recommendation to buy or sell any stock, and does not take account of your objectives, or your financial situation. We aim to bring you long-term focused analysis driven by fundamental data. Note that our analysis may not factor in the latest price-sensitive company announcements or qualitative material. Simply Wall St has no position in any stocks mentioned.
Have feedback on this article? Concerned about the content? Get in touch with us directly. Alternatively, email editorial-team@simplywallst.com