
- LIVE QUOTES
- LEARN
- HELP
 Wall Street Journal
EN
12 Analysts Have This To Say About HF Sinclair
Ratings for HF Sinclair (NYSE:DINO) were provided by 12 analysts in the past three months, showcasing a mix of bullish and bearish perspectives.
The following table summarizes their recent ratings, shedding light on the changing sentiments within the past 30 days and comparing them to the preceding months.
| Bullish | Somewhat Bullish | Indifferent | Somewhat Bearish | Bearish | |
|---|---|---|---|---|---|
| Total Ratings | 0 | 5 | 7 | 0 | 0 |
| Last 30D | 0 | 0 | 1 | 0 | 0 |
| 1M Ago | 0 | 1 | 1 | 0 | 0 |
| 2M Ago | 0 | 2 | 2 | 0 | 0 |
| 3M Ago | 0 | 2 | 3 | 0 | 0 |
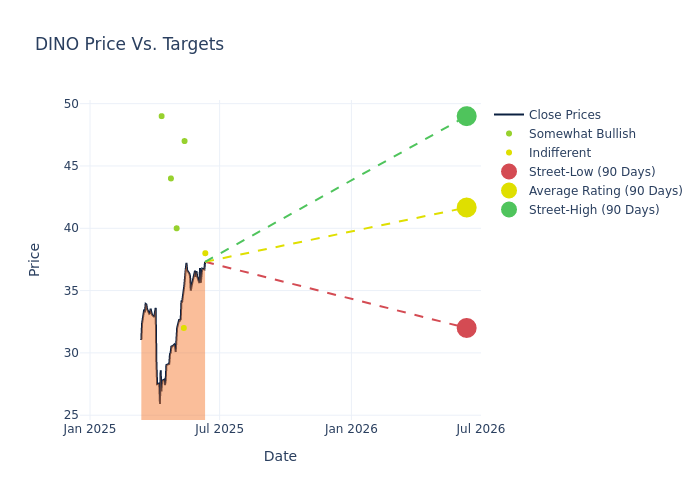
Analysts have set 12-month price targets for HF Sinclair, revealing an average target of $40.17, a high estimate of $50.00, and a low estimate of $29.00. A 4.36% drop is evident in the current average compared to the previous average price target of $42.00.
Analyzing Analyst Ratings: A Detailed Breakdown
The analysis of recent analyst actions sheds light on the perception of HF Sinclair by financial experts. The following summary presents key analysts, their recent evaluations, and adjustments to ratings and price targets.
| Analyst | Analyst Firm | Action Taken | Rating | Current Price Target | Prior Price Target |
|---|---|---|---|---|---|
| Roger Read | Wells Fargo | Raises | Equal-Weight | $38.00 | $34.00 |
| Nitin Kumar | Mizuho | Raises | Outperform | $47.00 | $40.00 |
| Theresa Chen | Barclays | Raises | Equal-Weight | $32.00 | $29.00 |
| Roger Read | Wells Fargo | Lowers | Equal-Weight | $34.00 | $44.00 |
| Ryan Todd | Piper Sandler | Lowers | Overweight | $40.00 | $46.00 |
| Connor Lynagh | Morgan Stanley | Lowers | Overweight | $44.00 | $50.00 |
| Theresa Chen | Barclays | Lowers | Equal-Weight | $29.00 | $35.00 |
| Paul Cheng | Scotiabank | Lowers | Sector Outperform | $49.00 | $51.00 |
| Nitin Kumar | Mizuho | Lowers | Neutral | $40.00 | $45.00 |
| Roger Read | Wells Fargo | Raises | Equal-Weight | $44.00 | $42.00 |
| Theresa Chen | Barclays | Lowers | Equal-Weight | $35.00 | $37.00 |
| Connor Lynagh | Morgan Stanley | Lowers | Overweight | $50.00 | $51.00 |
Key Insights:
- Action Taken: Responding to changing market dynamics and company performance, analysts update their recommendations. Whether they 'Maintain', 'Raise', or 'Lower' their stance, it signifies their response to recent developments related to HF Sinclair. This offers insight into analysts' perspectives on the current state of the company.
- Rating: Delving into assessments, analysts assign qualitative values, from 'Outperform' to 'Underperform'. These ratings communicate expectations for the relative performance of HF Sinclair compared to the broader market.
- Price Targets: Analysts explore the dynamics of price targets, providing estimates for the future value of HF Sinclair's stock. This examination reveals shifts in analysts' expectations over time.
Analyzing these analyst evaluations alongside relevant financial metrics can provide a comprehensive view of HF Sinclair's market position. Stay informed and make data-driven decisions with the assistance of our Ratings Table.
Stay up to date on HF Sinclair analyst ratings.
Discovering HF Sinclair: A Closer Look
HF Sinclair is an integrated petroleum refiner that owns and operates seven refineries serving the Rockies, midcontinent, Southwest, and Pacific Northwest, with a total crude oil throughput capacity of 678,000 barrels per day. It can produce 380 million gallons of renewable diesel annually. It holds a marketing business with over 300 distributors and 1,500 wholesale branded sites across 30 states. It also owns and operates 4,400 miles of petroleum product pipelines and terminals principally in the southwestern United States.
HF Sinclair: A Financial Overview
Market Capitalization Analysis: Reflecting a smaller scale, the company's market capitalization is positioned below industry averages. This could be attributed to factors such as growth expectations or operational capacity.
Decline in Revenue: Over the 3M period, HF Sinclair faced challenges, resulting in a decline of approximately -9.35% in revenue growth as of 31 March, 2025. This signifies a reduction in the company's top-line earnings. When compared to others in the Energy sector, the company faces challenges, achieving a growth rate lower than the average among peers.
Net Margin: HF Sinclair's net margin excels beyond industry benchmarks, reaching -0.08%. This signifies efficient cost management and strong financial health.
Return on Equity (ROE): HF Sinclair's ROE surpasses industry standards, highlighting the company's exceptional financial performance. With an impressive -0.05% ROE, the company effectively utilizes shareholder equity capital.
Return on Assets (ROA): HF Sinclair's ROA stands out, surpassing industry averages. With an impressive ROA of -0.03%, the company demonstrates effective utilization of assets and strong financial performance.
Debt Management: HF Sinclair's debt-to-equity ratio is below the industry average at 0.34, reflecting a lower dependency on debt financing and a more conservative financial approach.
The Core of Analyst Ratings: What Every Investor Should Know
Benzinga tracks 150 analyst firms and reports on their stock expectations. Analysts typically arrive at their conclusions by predicting how much money a company will make in the future, usually the upcoming five years, and how risky or predictable that company's revenue streams are.
Analysts attend company conference calls and meetings, research company financial statements, and communicate with insiders to publish their ratings on stocks. Analysts typically rate each stock once per quarter or whenever the company has a major update.
Some analysts also offer predictions for helpful metrics such as earnings, revenue, and growth estimates to provide further guidance as to what to do with certain tickers. It is important to keep in mind that while stock and sector analysts are specialists, they are also human and can only forecast their beliefs to traders.
Breaking: Wall Street's Next Big Mover
Benzinga's #1 analyst just identified a stock poised for explosive growth. This under-the-radar company could surge 200%+ as major market shifts unfold. Click here for urgent details.
This article was generated by Benzinga's automated content engine and reviewed by an editor.