
- LIVE QUOTES
- LEARN
- HELP
 Wall Street Journal
EN
We Think NewMarket (NYSE:NEU) Can Stay On Top Of Its Debt
David Iben put it well when he said, 'Volatility is not a risk we care about. What we care about is avoiding the permanent loss of capital.' It's only natural to consider a company's balance sheet when you examine how risky it is, since debt is often involved when a business collapses. We note that NewMarket Corporation (NYSE:NEU) does have debt on its balance sheet. But the more important question is: how much risk is that debt creating?
What Risk Does Debt Bring?
Debt and other liabilities become risky for a business when it cannot easily fulfill those obligations, either with free cash flow or by raising capital at an attractive price. Part and parcel of capitalism is the process of 'creative destruction' where failed businesses are mercilessly liquidated by their bankers. However, a more common (but still painful) scenario is that it has to raise new equity capital at a low price, thus permanently diluting shareholders. Of course, the upside of debt is that it often represents cheap capital, especially when it replaces dilution in a company with the ability to reinvest at high rates of return. When we examine debt levels, we first consider both cash and debt levels, together.
How Much Debt Does NewMarket Carry?
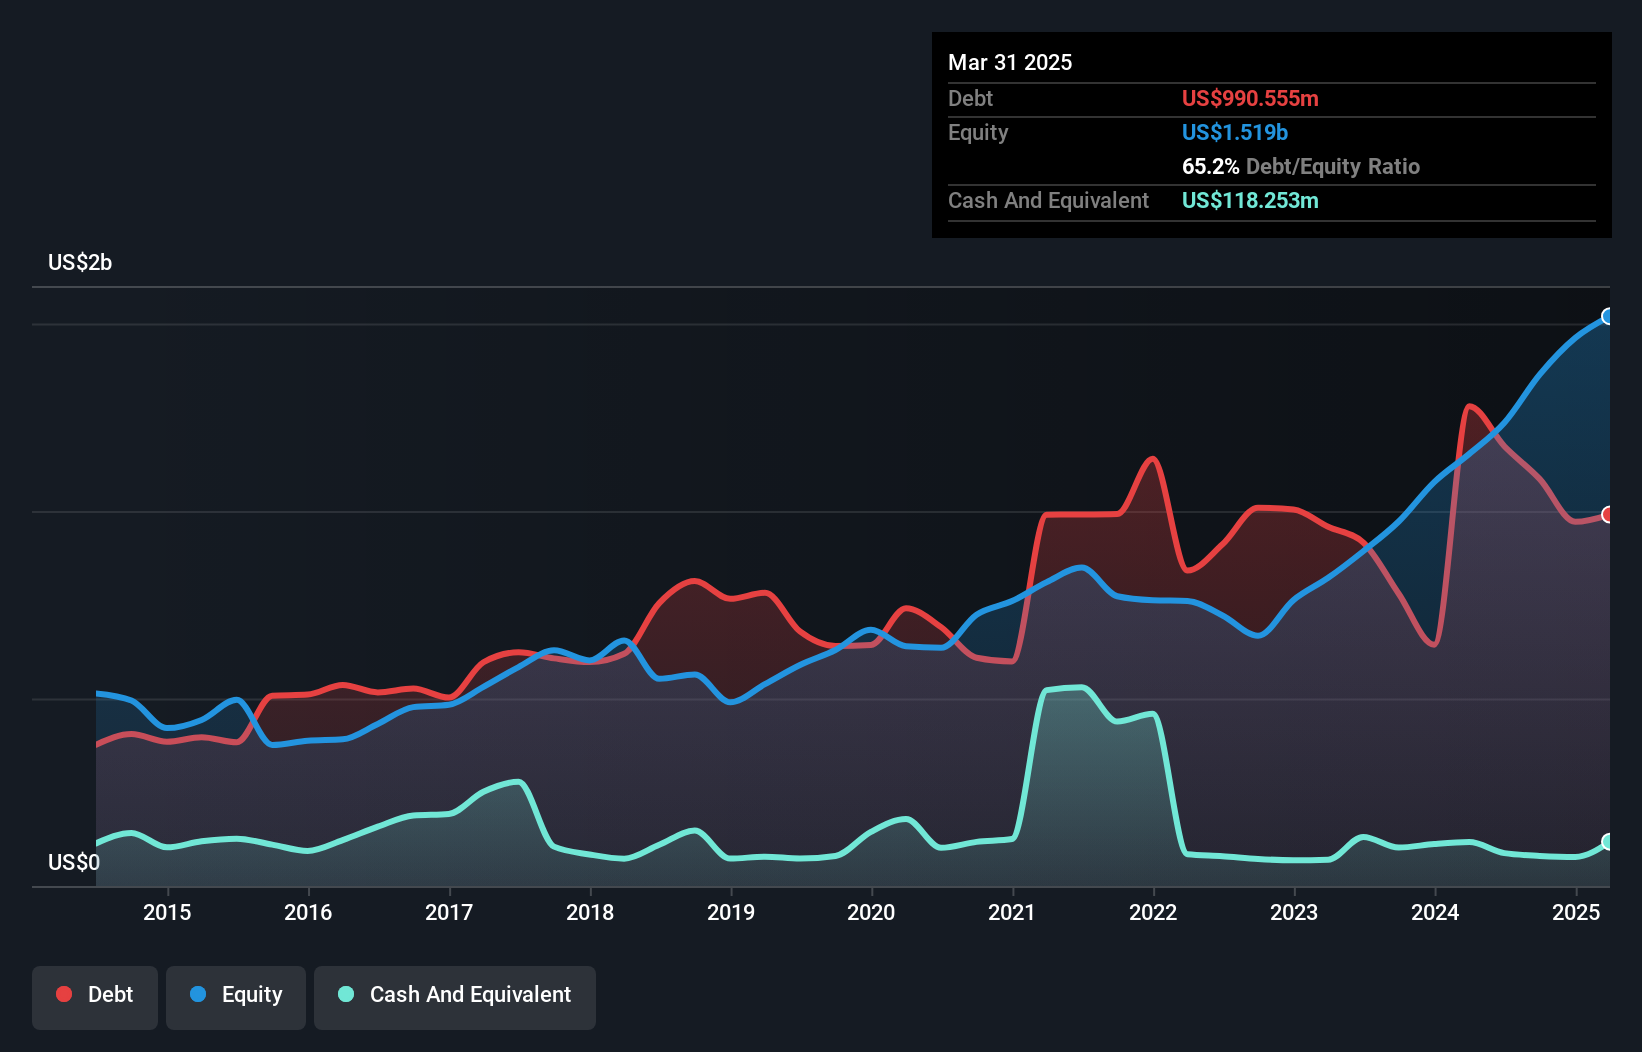
You can click the graphic below for the historical numbers, but it shows that NewMarket had US$990.6m of debt in March 2025, down from US$1.28b, one year before. However, it does have US$118.3m in cash offsetting this, leading to net debt of about US$872.3m.
A Look At NewMarket's Liabilities
According to the last reported balance sheet, NewMarket had liabilities of US$396.3m due within 12 months, and liabilities of US$1.32b due beyond 12 months. On the other hand, it had cash of US$118.3m and US$463.3m worth of receivables due within a year. So it has liabilities totalling US$1.13b more than its cash and near-term receivables, combined.
Since publicly traded NewMarket shares are worth a total of US$6.12b, it seems unlikely that this level of liabilities would be a major threat. However, we do think it is worth keeping an eye on its balance sheet strength, as it may change over time.
View our latest analysis for NewMarket
We use two main ratios to inform us about debt levels relative to earnings. The first is net debt divided by earnings before interest, tax, depreciation, and amortization (EBITDA), while the second is how many times its earnings before interest and tax (EBIT) covers its interest expense (or its interest cover, for short). Thus we consider debt relative to earnings both with and without depreciation and amortization expenses.
NewMarket has a low net debt to EBITDA ratio of only 1.1. And its EBIT covers its interest expense a whopping 12.5 times over. So we're pretty relaxed about its super-conservative use of debt. Another good sign is that NewMarket has been able to increase its EBIT by 22% in twelve months, making it easier to pay down debt. There's no doubt that we learn most about debt from the balance sheet. But you can't view debt in total isolation; since NewMarket will need earnings to service that debt. So if you're keen to discover more about its earnings, it might be worth checking out this graph of its long term earnings trend.
Finally, a company can only pay off debt with cold hard cash, not accounting profits. So it's worth checking how much of that EBIT is backed by free cash flow. During the last three years, NewMarket produced sturdy free cash flow equating to 71% of its EBIT, about what we'd expect. This cold hard cash means it can reduce its debt when it wants to.
Our View
Happily, NewMarket's impressive interest cover implies it has the upper hand on its debt. And the good news does not stop there, as its conversion of EBIT to free cash flow also supports that impression! Looking at the bigger picture, we think NewMarket's use of debt seems quite reasonable and we're not concerned about it. After all, sensible leverage can boost returns on equity. The balance sheet is clearly the area to focus on when you are analysing debt. But ultimately, every company can contain risks that exist outside of the balance sheet. We've identified 1 warning sign with NewMarket , and understanding them should be part of your investment process.
If, after all that, you're more interested in a fast growing company with a rock-solid balance sheet, then check out our list of net cash growth stocks without delay.
Have feedback on this article? Concerned about the content? Get in touch with us directly. Alternatively, email editorial-team (at) simplywallst.com.
This article by Simply Wall St is general in nature. We provide commentary based on historical data and analyst forecasts only using an unbiased methodology and our articles are not intended to be financial advice. It does not constitute a recommendation to buy or sell any stock, and does not take account of your objectives, or your financial situation. We aim to bring you long-term focused analysis driven by fundamental data. Note that our analysis may not factor in the latest price-sensitive company announcements or qualitative material. Simply Wall St has no position in any stocks mentioned.