
- LIVE QUOTES
- LEARN
- HELP
 Wall Street Journal
EN
3 Global Penny Stocks With Market Caps Up To US$2B
Global markets have recently experienced a mix of optimism and caution, with U.S. stocks closing higher amid fluctuating trade policies and easing inflation rates. In this context, investors often seek opportunities that balance affordability with growth potential. Penny stocks, despite being an older term, continue to attract attention for their ability to offer value in smaller or newer companies backed by strong financials.
Top 10 Penny Stocks Globally
| Name | Share Price | Market Cap | Rewards & Risks |
| CNMC Goldmine Holdings (Catalist:5TP) | SGD0.43 | SGD174.27M | ✅ 4 ⚠️ 3 View Analysis > |
| Yangzijiang Shipbuilding (Holdings) (SGX:BS6) | SGD2.12 | SGD8.34B | ✅ 5 ⚠️ 0 View Analysis > |
| Angler Gaming (NGM:ANGL) | SEK3.72 | SEK278.94M | ✅ 4 ⚠️ 2 View Analysis > |
| Rexit Berhad (KLSE:REXIT) | MYR0.61 | MYR105.66M | ✅ 3 ⚠️ 4 View Analysis > |
| Lever Style (SEHK:1346) | HK$1.15 | HK$719.28M | ✅ 4 ⚠️ 2 View Analysis > |
| LSL Property Services (LSE:LSL) | £2.77 | £285.64M | ✅ 5 ⚠️ 1 View Analysis > |
| Foresight Group Holdings (LSE:FSG) | £3.98 | £448.1M | ✅ 4 ⚠️ 1 View Analysis > |
| McChip Resources (TSXV:MCS) | CA$0.82 | CA$4.8M | ✅ 2 ⚠️ 5 View Analysis > |
| EZZ Life Science Holdings (ASX:EZZ) | A$1.545 | A$72.65M | ✅ 4 ⚠️ 2 View Analysis > |
| Tasmea (ASX:TEA) | A$3.15 | A$678.71M | ✅ 3 ⚠️ 2 View Analysis > |
Click here to see the full list of 5,608 stocks from our Global Penny Stocks screener.
We're going to check out a few of the best picks from our screener tool.
Huapont Life SciencesLtd (SZSE:002004)
Simply Wall St Financial Health Rating: ★★★★★☆
Overview: Huapont Life Sciences Co., Ltd. operates in the fields of medicine, medical care, agrochemicals, new materials, and tourism both in China and internationally, with a market cap of CN¥8.17 billion.
Operations: There are no specific revenue segments reported for Huapont Life Sciences Co., Ltd.
Market Cap: CN¥8.17B
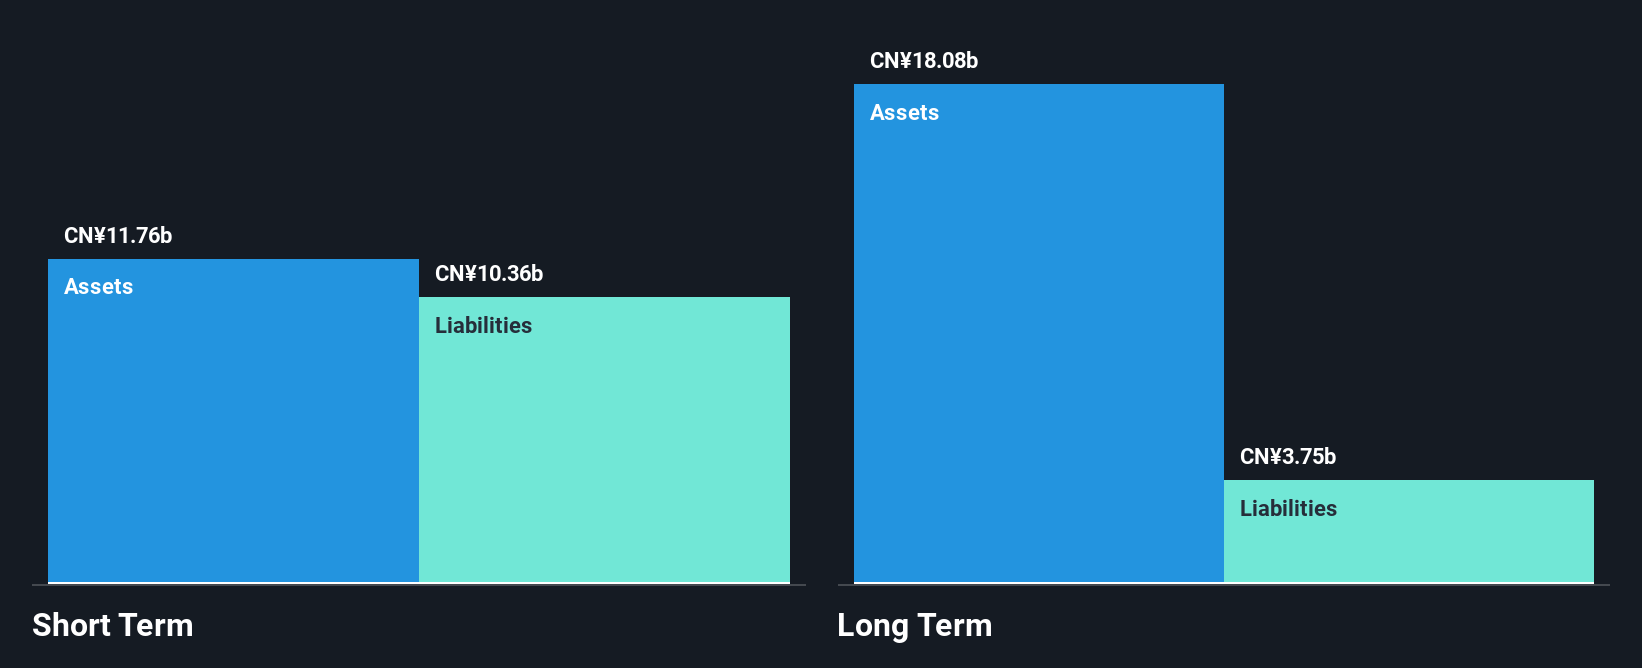
Huapont Life Sciences Co., Ltd. has shown mixed financial performance, with a net income of CN¥184.34 million for Q1 2025, improving from the previous year despite a slight decrease in sales. However, the company reported a net loss of CN¥298.99 million for 2024, contrasting with the prior year's profit. Its debt-to-equity ratio has improved over five years to 59.7%, and short-term assets exceed liabilities, indicating sound liquidity management. The board's average tenure is considered experienced at 5.2 years, but profitability remains elusive as earnings have declined significantly over five years due to increased losses.
- Dive into the specifics of Huapont Life SciencesLtd here with our thorough balance sheet health report.
- Gain insights into Huapont Life SciencesLtd's historical outcomes by reviewing our past performance report.
Shandong Mining Machinery Group (SZSE:002526)
Simply Wall St Financial Health Rating: ★★★★★☆
Overview: Shandong Mining Machinery Group Co., Ltd. operates in the manufacturing and distribution of mining machinery and equipment, with a market cap of CN¥6.36 billion.
Operations: Shandong Mining Machinery Group Co., Ltd. currently does not report any specific revenue segments.
Market Cap: CN¥6.36B
Shandong Mining Machinery Group Co., Ltd. has experienced fluctuating financial results, with a recent net income of CN¥53.08 million for Q1 2025, up from CN¥29.23 million the previous year, despite declining annual earnings and revenues in 2024 compared to 2023. The company maintains a strong liquidity position, with short-term assets exceeding liabilities and more cash than total debt. However, its return on equity remains low at 4.6%, and profit margins have slightly decreased from last year. The board is seasoned with an average tenure of 7.1 years, providing stability amid these financial challenges.
- Get an in-depth perspective on Shandong Mining Machinery Group's performance by reading our balance sheet health report here.
- Assess Shandong Mining Machinery Group's previous results with our detailed historical performance reports.
Fuan Pharmaceutical (Group) (SZSE:300194)
Simply Wall St Financial Health Rating: ★★★★★☆
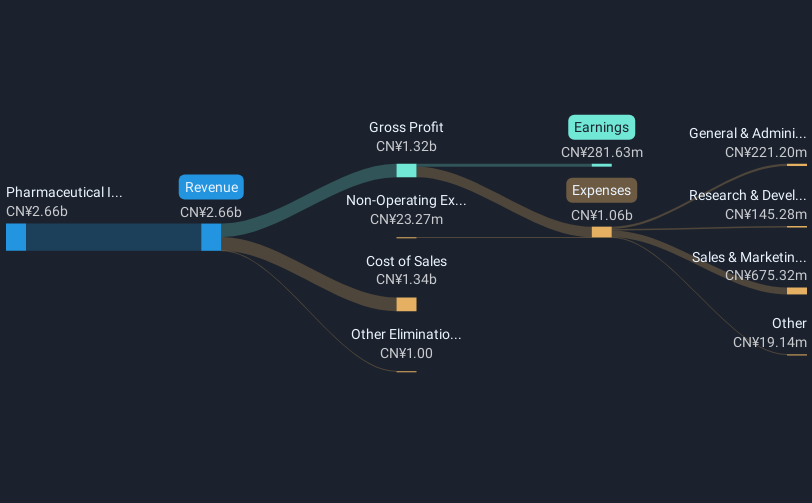
Overview: Fuan Pharmaceutical (Group) Co., Ltd. and its subsidiaries focus on researching, developing, producing, and selling chemical drugs in the People's Republic of China, with a market cap of CN¥4.95 billion.
Operations: Fuan Pharmaceutical (Group) Co., Ltd. has not reported any specific revenue segments.
Market Cap: CN¥4.95B
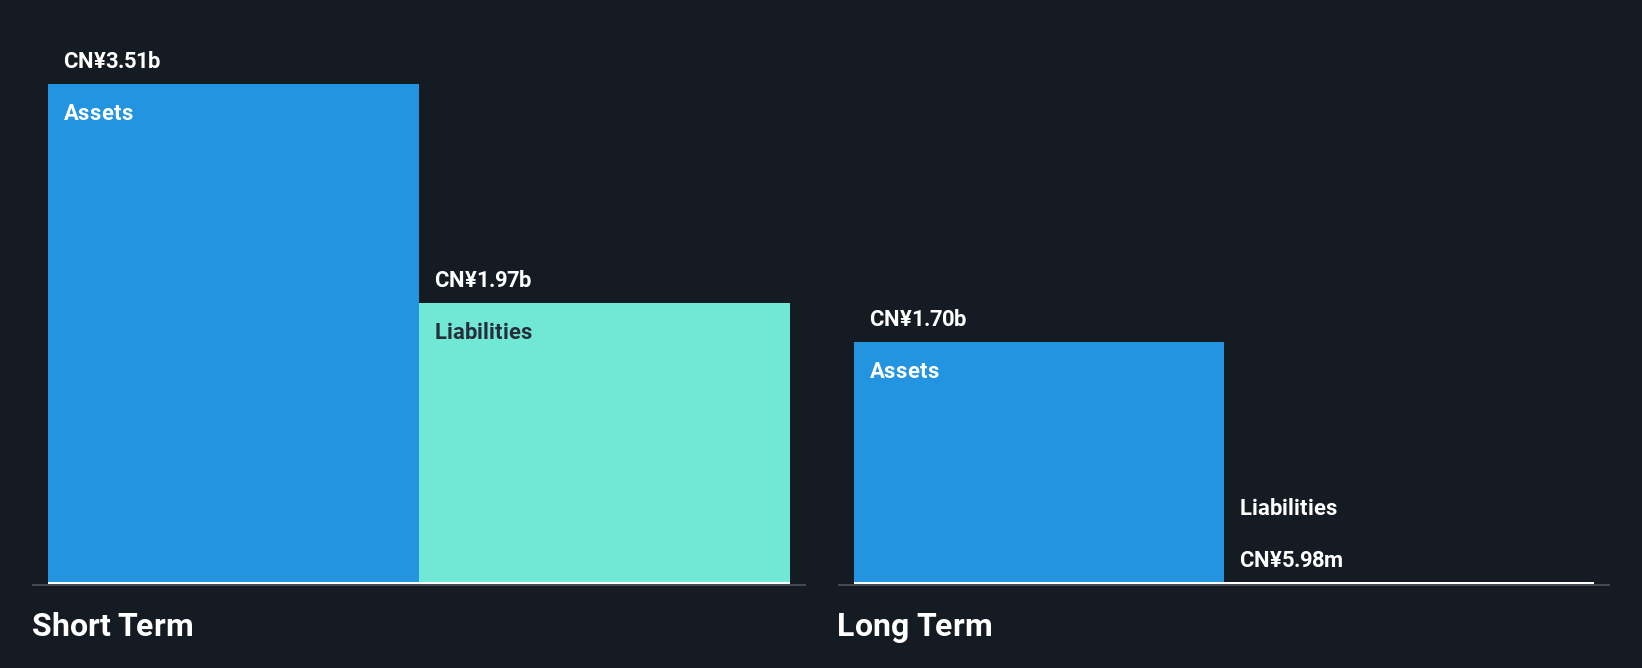
Fuan Pharmaceutical (Group) Co., Ltd. has demonstrated stable financial management, with short-term assets of CN¥2.1 billion surpassing both its long-term liabilities and short-term liabilities, indicating strong liquidity. Despite a significant increase in debt-to-equity ratio over the past five years, the company maintains more cash than total debt. Earnings have grown by 20.7% over the past year, outpacing industry averages and reflecting improved profit margins from 8.8% to 11.7%. However, recent quarterly results show a decline in sales and net income compared to last year, highlighting potential volatility in performance amidst broader market conditions.
- Click here to discover the nuances of Fuan Pharmaceutical (Group) with our detailed analytical financial health report.
- Understand Fuan Pharmaceutical (Group)'s track record by examining our performance history report.
Make It Happen
- Unlock our comprehensive list of 5,608 Global Penny Stocks by clicking here.
- Contemplating Other Strategies? The end of cancer? These 23 emerging AI stocks are developing tech that will allow early idenification of life changing disesaes like cancer and Alzheimer's.
This article by Simply Wall St is general in nature. We provide commentary based on historical data and analyst forecasts only using an unbiased methodology and our articles are not intended to be financial advice. It does not constitute a recommendation to buy or sell any stock, and does not take account of your objectives, or your financial situation. We aim to bring you long-term focused analysis driven by fundamental data. Note that our analysis may not factor in the latest price-sensitive company announcements or qualitative material. Simply Wall St has no position in any stocks mentioned.
Have feedback on this article? Concerned about the content? Get in touch with us directly. Alternatively, email editorial-team@simplywallst.com