
- LIVE QUOTES
- LEARN
- HELP
 Wall Street Journal
EN
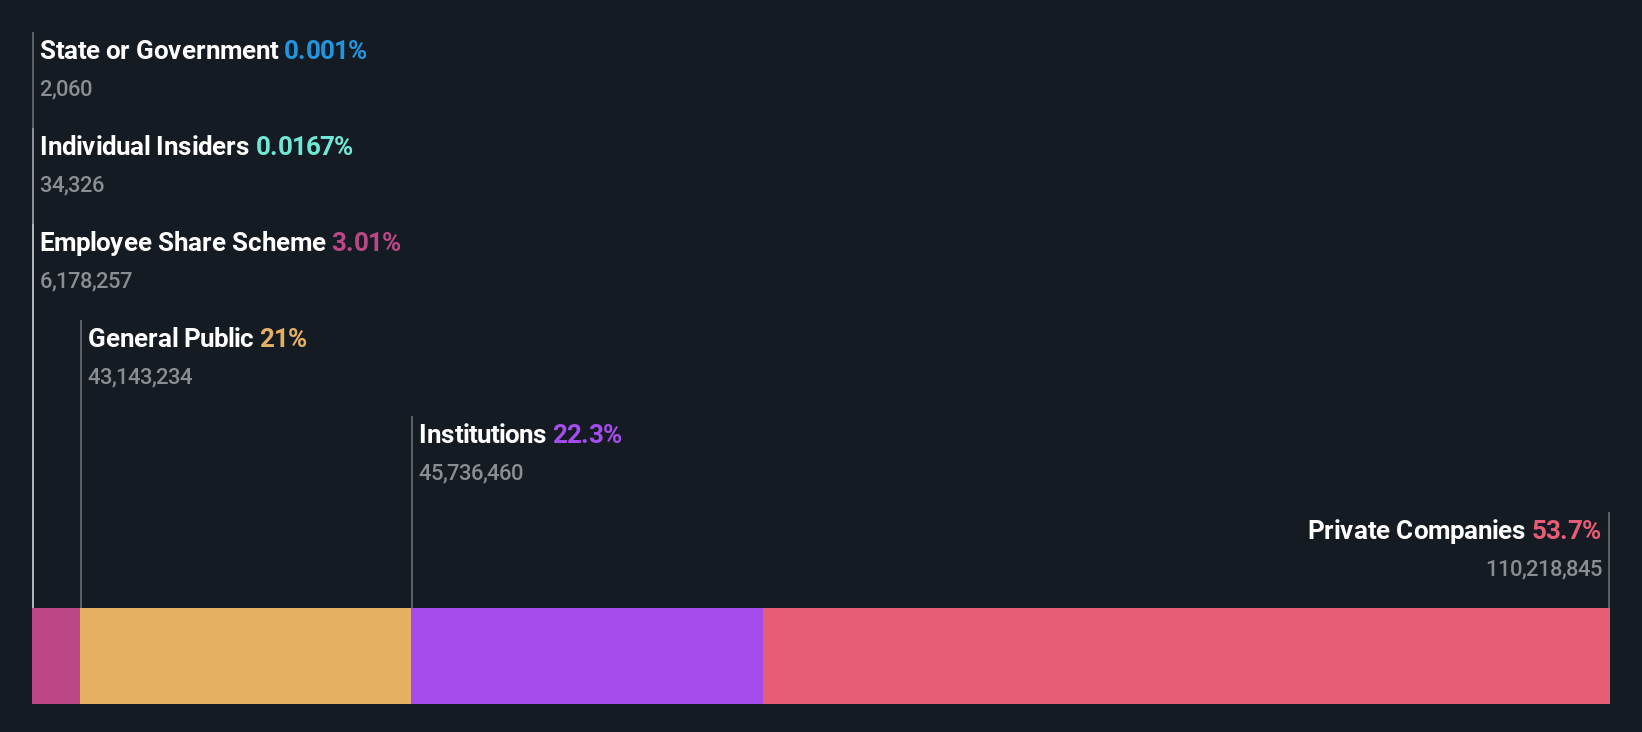
Thales S.A.'s (EPA:HO) largest shareholders are private companies with 54% ownership, institutions own 22%
Key Insights
- The considerable ownership by private companies in Thales indicates that they collectively have a greater say in management and business strategy
- 54% of the business is held by the top 2 shareholders
- 22% of Thales is held by Institutions
A look at the shareholders of Thales S.A. (EPA:HO) can tell us which group is most powerful. And the group that holds the biggest piece of the pie are private companies with 54% ownership. Put another way, the group faces the maximum upside potential (or downside risk).
And institutions on the other hand have a 22% ownership in the company. Insiders often own a large chunk of younger, smaller, companies while huge companies tend to have institutions as shareholders.
Let's take a closer look to see what the different types of shareholders can tell us about Thales.
See our latest analysis for Thales
What Does The Institutional Ownership Tell Us About Thales?
Institutional investors commonly compare their own returns to the returns of a commonly followed index. So they generally do consider buying larger companies that are included in the relevant benchmark index.
As you can see, institutional investors have a fair amount of stake in Thales. This can indicate that the company has a certain degree of credibility in the investment community. However, it is best to be wary of relying on the supposed validation that comes with institutional investors. They too, get it wrong sometimes. It is not uncommon to see a big share price drop if two large institutional investors try to sell out of a stock at the same time. So it is worth checking the past earnings trajectory of Thales, (below). Of course, keep in mind that there are other factors to consider, too.

We note that hedge funds don't have a meaningful investment in Thales. Looking at our data, we can see that the largest shareholder is Groupe Industriel Marcel Dassault with 27% of shares outstanding. With 27% and 3.0% of the shares outstanding respectively, TSA Société Anonyme and Thales, ESOP are the second and third largest shareholders.
After doing some more digging, we found that the top 2 shareholders collectively control more than half of the company's shares, implying that they have considerable power to influence the company's decisions.
While it makes sense to study institutional ownership data for a company, it also makes sense to study analyst sentiments to know which way the wind is blowing. Quite a few analysts cover the stock, so you could look into forecast growth quite easily.
Insider Ownership Of Thales
While the precise definition of an insider can be subjective, almost everyone considers board members to be insiders. Company management run the business, but the CEO will answer to the board, even if he or she is a member of it.
Most consider insider ownership a positive because it can indicate the board is well aligned with other shareholders. However, on some occasions too much power is concentrated within this group.
Our data suggests that insiders own under 1% of Thales S.A. in their own names. But they may have an indirect interest through a corporate structure that we haven't picked up on. Being so large, we would not expect insiders to own a large proportion of the stock. Collectively, they own €9.2m of stock. Arguably recent buying and selling is just as important to consider. You can click here to see if insiders have been buying or selling.
General Public Ownership
The general public-- including retail investors -- own 21% stake in the company, and hence can't easily be ignored. While this group can't necessarily call the shots, it can certainly have a real influence on how the company is run.
Private Company Ownership
It seems that Private Companies own 54%, of the Thales stock. It's hard to draw any conclusions from this fact alone, so its worth looking into who owns those private companies. Sometimes insiders or other related parties have an interest in shares in a public company through a separate private company.

Next Steps:
While it is well worth considering the different groups that own a company, there are other factors that are even more important. Consider for instance, the ever-present spectre of investment risk. We've identified 1 warning sign with Thales , and understanding them should be part of your investment process.
If you are like me, you may want to think about whether this company will grow or shrink. Luckily, you can check this free report showing analyst forecasts for its future.
NB: Figures in this article are calculated using data from the last twelve months, which refer to the 12-month period ending on the last date of the month the financial statement is dated. This may not be consistent with full year annual report figures.
Have feedback on this article? Concerned about the content? Get in touch with us directly. Alternatively, email editorial-team (at) simplywallst.com.
This article by Simply Wall St is general in nature. We provide commentary based on historical data and analyst forecasts only using an unbiased methodology and our articles are not intended to be financial advice. It does not constitute a recommendation to buy or sell any stock, and does not take account of your objectives, or your financial situation. We aim to bring you long-term focused analysis driven by fundamental data. Note that our analysis may not factor in the latest price-sensitive company announcements or qualitative material. Simply Wall St has no position in any stocks mentioned.