
- LIVE QUOTES
- LEARN
- HELP
 Wall Street Journal
EN
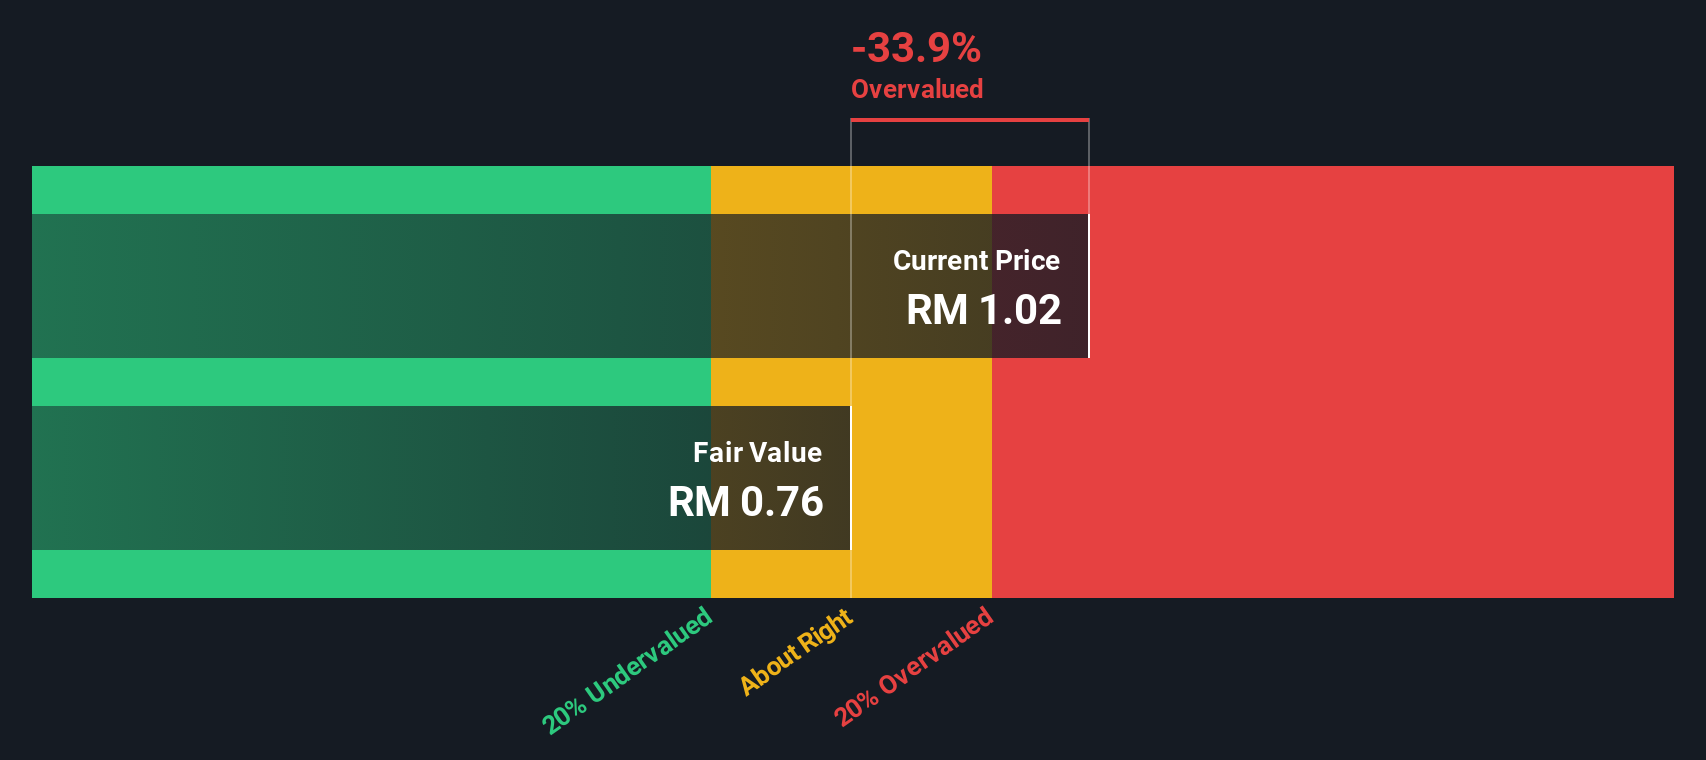
Mah Sing Group Berhad's (KLSE:MAHSING) Intrinsic Value Is Potentially 25% Below Its Share Price
Key Insights
- The projected fair value for Mah Sing Group Berhad is RM0.76 based on 2 Stage Free Cash Flow to Equity
- Mah Sing Group Berhad is estimated to be 34% overvalued based on current share price of RM1.02
- The RM2.09 analyst price target for MAHSING is 174% more than our estimate of fair value
How far off is Mah Sing Group Berhad (KLSE:MAHSING) from its intrinsic value? Using the most recent financial data, we'll take a look at whether the stock is fairly priced by estimating the company's future cash flows and discounting them to their present value. We will use the Discounted Cash Flow (DCF) model on this occasion. It may sound complicated, but actually it is quite simple!
We would caution that there are many ways of valuing a company and, like the DCF, each technique has advantages and disadvantages in certain scenarios. If you still have some burning questions about this type of valuation, take a look at the Simply Wall St analysis model.
What's The Estimated Valuation?
We are going to use a two-stage DCF model, which, as the name states, takes into account two stages of growth. The first stage is generally a higher growth period which levels off heading towards the terminal value, captured in the second 'steady growth' period. To begin with, we have to get estimates of the next ten years of cash flows. Where possible we use analyst estimates, but when these aren't available we extrapolate the previous free cash flow (FCF) from the last estimate or reported value. We assume companies with shrinking free cash flow will slow their rate of shrinkage, and that companies with growing free cash flow will see their growth rate slow, over this period. We do this to reflect that growth tends to slow more in the early years than it does in later years.
Generally we assume that a dollar today is more valuable than a dollar in the future, so we discount the value of these future cash flows to their estimated value in today's dollars:
10-year free cash flow (FCF) forecast
| 2025 | 2026 | 2027 | 2028 | 2029 | 2030 | 2031 | 2032 | 2033 | 2034 | |
| Levered FCF (MYR, Millions) | -RM30.3m | RM158.7m | RM270.0m | RM241.2m | RM225.8m | RM218.1m | RM215.4m | RM215.8m | RM218.4m | RM222.7m |
| Growth Rate Estimate Source | Analyst x2 | Analyst x2 | Analyst x1 | Est @ -10.68% | Est @ -6.39% | Est @ -3.38% | Est @ -1.27% | Est @ 0.20% | Est @ 1.23% | Est @ 1.95% |
| Present Value (MYR, Millions) Discounted @ 12% | -RM27.1 | RM127 | RM193 | RM154 | RM129 | RM112 | RM98.5 | RM88.3 | RM79.9 | RM72.9 |
("Est" = FCF growth rate estimated by Simply Wall St)
Present Value of 10-year Cash Flow (PVCF) = RM1.0b
The second stage is also known as Terminal Value, this is the business's cash flow after the first stage. The Gordon Growth formula is used to calculate Terminal Value at a future annual growth rate equal to the 5-year average of the 10-year government bond yield of 3.6%. We discount the terminal cash flows to today's value at a cost of equity of 12%.
Terminal Value (TV)= FCF2034 × (1 + g) ÷ (r – g) = RM223m× (1 + 3.6%) ÷ (12%– 3.6%) = RM2.8b
Present Value of Terminal Value (PVTV)= TV / (1 + r)10= RM2.8b÷ ( 1 + 12%)10= RM923m
The total value, or equity value, is then the sum of the present value of the future cash flows, which in this case is RM2.0b. The last step is to then divide the equity value by the number of shares outstanding. Compared to the current share price of RM1.0, the company appears potentially overvalued at the time of writing. The assumptions in any calculation have a big impact on the valuation, so it is better to view this as a rough estimate, not precise down to the last cent.
Important Assumptions
The calculation above is very dependent on two assumptions. The first is the discount rate and the other is the cash flows. Part of investing is coming up with your own evaluation of a company's future performance, so try the calculation yourself and check your own assumptions. The DCF also does not consider the possible cyclicality of an industry, or a company's future capital requirements, so it does not give a full picture of a company's potential performance. Given that we are looking at Mah Sing Group Berhad as potential shareholders, the cost of equity is used as the discount rate, rather than the cost of capital (or weighted average cost of capital, WACC) which accounts for debt. In this calculation we've used 12%, which is based on a levered beta of 1.379. Beta is a measure of a stock's volatility, compared to the market as a whole. We get our beta from the industry average beta of globally comparable companies, with an imposed limit between 0.8 and 2.0, which is a reasonable range for a stable business.
Check out our latest analysis for Mah Sing Group Berhad
SWOT Analysis for Mah Sing Group Berhad
- Debt is not viewed as a risk.
- Dividends are covered by earnings and cash flows.
- Earnings growth over the past year underperformed the Real Estate industry.
- Dividend is low compared to the top 25% of dividend payers in the Real Estate market.
- Annual earnings are forecast to grow faster than the Malaysian market.
- Good value based on P/E ratio compared to estimated Fair P/E ratio.
- Revenue is forecast to grow slower than 20% per year.

Looking Ahead:
Whilst important, the DCF calculation is only one of many factors that you need to assess for a company. The DCF model is not a perfect stock valuation tool. Instead the best use for a DCF model is to test certain assumptions and theories to see if they would lead to the company being undervalued or overvalued. For example, changes in the company's cost of equity or the risk free rate can significantly impact the valuation. Can we work out why the company is trading at a premium to intrinsic value? For Mah Sing Group Berhad, we've put together three additional items you should further research:
- Risks: We feel that you should assess the 1 warning sign for Mah Sing Group Berhad we've flagged before making an investment in the company.
- Future Earnings: How does MAHSING's growth rate compare to its peers and the wider market? Dig deeper into the analyst consensus number for the upcoming years by interacting with our free analyst growth expectation chart.
- Other High Quality Alternatives: Do you like a good all-rounder? Explore our interactive list of high quality stocks to get an idea of what else is out there you may be missing!
PS. Simply Wall St updates its DCF calculation for every Malaysian stock every day, so if you want to find the intrinsic value of any other stock just search here.
Have feedback on this article? Concerned about the content? Get in touch with us directly. Alternatively, email editorial-team (at) simplywallst.com.
This article by Simply Wall St is general in nature. We provide commentary based on historical data and analyst forecasts only using an unbiased methodology and our articles are not intended to be financial advice. It does not constitute a recommendation to buy or sell any stock, and does not take account of your objectives, or your financial situation. We aim to bring you long-term focused analysis driven by fundamental data. Note that our analysis may not factor in the latest price-sensitive company announcements or qualitative material. Simply Wall St has no position in any stocks mentioned.