
- LIVE QUOTES
- LEARN
- HELP
 Wall Street Journal
EN
Assessing Chemours: Insights From 8 Financial Analysts
Chemours (NYSE:CC) underwent analysis by 8 analysts in the last quarter, revealing a spectrum of viewpoints from bullish to bearish.
The following table encapsulates their recent ratings, offering a glimpse into the evolving sentiments over the past 30 days and comparing them to the preceding months.
| Bullish | Somewhat Bullish | Indifferent | Somewhat Bearish | Bearish | |
|---|---|---|---|---|---|
| Total Ratings | 2 | 2 | 4 | 0 | 0 |
| Last 30D | 0 | 0 | 1 | 0 | 0 |
| 1M Ago | 1 | 1 | 2 | 0 | 0 |
| 2M Ago | 1 | 0 | 1 | 0 | 0 |
| 3M Ago | 0 | 1 | 0 | 0 | 0 |
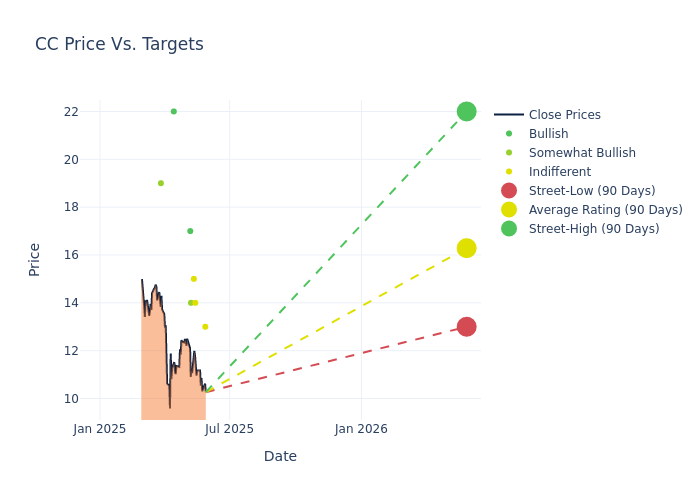
The 12-month price targets assessed by analysts reveal further insights, featuring an average target of $16.25, a high estimate of $22.00, and a low estimate of $13.00. Experiencing a 18.26% decline, the current average is now lower than the previous average price target of $19.88.
Decoding Analyst Ratings: A Detailed Look
An in-depth analysis of recent analyst actions unveils how financial experts perceive Chemours. The following summary outlines key analysts, their recent evaluations, and adjustments to ratings and price targets.
| Analyst | Analyst Firm | Action Taken | Rating | Current Price Target | Prior Price Target |
|---|---|---|---|---|---|
| Michael Leithead | Barclays | Lowers | Equal-Weight | $13.00 | $16.00 |
| Duffy Fischer | Goldman Sachs | Lowers | Neutral | $14.00 | $21.00 |
| Vincent Andrews | Morgan Stanley | Lowers | Equal-Weight | $15.00 | $22.00 |
| Arun Viswanathan | RBC Capital | Lowers | Outperform | $14.00 | $17.00 |
| Joshua Spector | UBS | Lowers | Buy | $17.00 | $18.00 |
| Peter Osterland | Truist Securities | Lowers | Buy | $22.00 | $27.00 |
| Michael Leithead | Barclays | Lowers | Equal-Weight | $16.00 | $19.00 |
| John Roberts | Mizuho | Maintains | Outperform | $19.00 | $19.00 |
Key Insights:
- Action Taken: In response to dynamic market conditions and company performance, analysts update their recommendations. Whether they 'Maintain', 'Raise', or 'Lower' their stance, it signifies their reaction to recent developments related to Chemours. This insight gives a snapshot of analysts' perspectives on the current state of the company.
- Rating: Analyzing trends, analysts offer qualitative evaluations, ranging from 'Outperform' to 'Underperform'. These ratings convey expectations for the relative performance of Chemours compared to the broader market.
- Price Targets: Analysts navigate through adjustments in price targets, providing estimates for Chemours's future value. Comparing current and prior targets offers insights into analysts' evolving expectations.
Understanding these analyst evaluations alongside key financial indicators can offer valuable insights into Chemours's market standing. Stay informed and make well-considered decisions with our Ratings Table.
Stay up to date on Chemours analyst ratings.
If you are interested in following small-cap stock news and performance you can start by tracking it here.
All You Need to Know About Chemours
The Chemours Co is a provider of chemicals. It delivers customized solutions with a wide range of industrial and specialty chemicals products for various markets including coatings, plastics, refrigeration, air conditioning, etc. The company's operating segments include Titanium Technologies, Thermal & Specialized Solutions, and Advanced Performance Materials. It generates maximum revenue from the Titanium Technologies segment. The Titanium Technologies segment is a producer of TiO2 pigment, a premium white pigment used to deliver whiteness, brightness, opacity, durability, efficiency, and protection across a variety of applications. Geographically, the company derives a majority of its revenue from North America.
Understanding the Numbers: Chemours's Finances
Market Capitalization Analysis: With an elevated market capitalization, the company stands out above industry averages, showcasing substantial size and market acknowledgment.
Positive Revenue Trend: Examining Chemours's financials over 3M reveals a positive narrative. The company achieved a noteworthy revenue growth rate of 0.44% as of 31 March, 2025, showcasing a substantial increase in top-line earnings. As compared to competitors, the company encountered difficulties, with a growth rate lower than the average among peers in the Materials sector.
Net Margin: Chemours's net margin excels beyond industry benchmarks, reaching -0.29%. This signifies efficient cost management and strong financial health.
Return on Equity (ROE): Chemours's ROE excels beyond industry benchmarks, reaching -0.68%. This signifies robust financial management and efficient use of shareholder equity capital.
Return on Assets (ROA): Chemours's financial strength is reflected in its exceptional ROA, which exceeds industry averages. With a remarkable ROA of -0.05%, the company showcases efficient use of assets and strong financial health.
Debt Management: With a high debt-to-equity ratio of 7.57, Chemours faces challenges in effectively managing its debt levels, indicating potential financial strain.
What Are Analyst Ratings?
Benzinga tracks 150 analyst firms and reports on their stock expectations. Analysts typically arrive at their conclusions by predicting how much money a company will make in the future, usually the upcoming five years, and how risky or predictable that company's revenue streams are.
Analysts attend company conference calls and meetings, research company financial statements, and communicate with insiders to publish their ratings on stocks. Analysts typically rate each stock once per quarter or whenever the company has a major update.
Some analysts will also offer forecasts for metrics like growth estimates, earnings, and revenue to provide further guidance on stocks. Investors who use analyst ratings should note that this specialized advice comes from humans and may be subject to error.
Breaking: Wall Street's Next Big Mover
Benzinga's #1 analyst just identified a stock poised for explosive growth. This under-the-radar company could surge 200%+ as major market shifts unfold. Click here for urgent details.
This article was generated by Benzinga's automated content engine and reviewed by an editor.