
- LIVE QUOTES
- LEARN
- HELP
 Wall Street Journal
EN
Institutional investors may overlook Ameriprise Financial, Inc.'s (NYSE:AMP) recent US$1.7b market cap drop as long-term gains remain positive
Key Insights
- Given the large stake in the stock by institutions, Ameriprise Financial's stock price might be vulnerable to their trading decisions
- A total of 13 investors have a majority stake in the company with 51% ownership
- Analyst forecasts along with ownership data serve to give a strong idea about prospects for a business
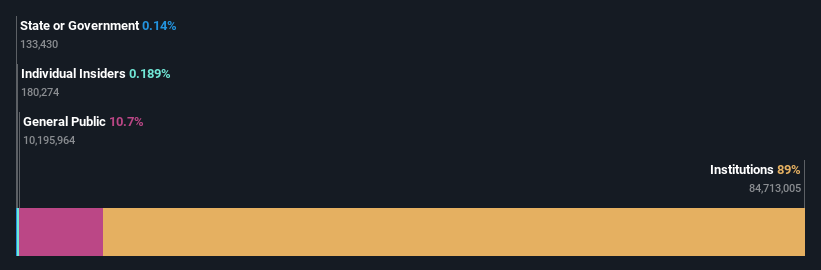
A look at the shareholders of Ameriprise Financial, Inc. (NYSE:AMP) can tell us which group is most powerful. The group holding the most number of shares in the company, around 89% to be precise, is institutions. That is, the group stands to benefit the most if the stock rises (or lose the most if there is a downturn).
Institutional investors endured the highest losses after the company's market cap fell by US$1.7b last week. However, the 16% one-year return to shareholders may have helped lessen their pain. We would assume however, that they would be on the lookout for weakness in the future.
Let's delve deeper into each type of owner of Ameriprise Financial, beginning with the chart below.
See our latest analysis for Ameriprise Financial
What Does The Institutional Ownership Tell Us About Ameriprise Financial?
Many institutions measure their performance against an index that approximates the local market. So they usually pay more attention to companies that are included in major indices.
As you can see, institutional investors have a fair amount of stake in Ameriprise Financial. This can indicate that the company has a certain degree of credibility in the investment community. However, it is best to be wary of relying on the supposed validation that comes with institutional investors. They too, get it wrong sometimes. It is not uncommon to see a big share price drop if two large institutional investors try to sell out of a stock at the same time. So it is worth checking the past earnings trajectory of Ameriprise Financial, (below). Of course, keep in mind that there are other factors to consider, too.

Investors should note that institutions actually own more than half the company, so they can collectively wield significant power. Ameriprise Financial is not owned by hedge funds. Looking at our data, we can see that the largest shareholder is The Vanguard Group, Inc. with 13% of shares outstanding. BlackRock, Inc. is the second largest shareholder owning 9.9% of common stock, and JP Morgan Asset Management holds about 5.6% of the company stock.
A closer look at our ownership figures suggests that the top 13 shareholders have a combined ownership of 51% implying that no single shareholder has a majority.
While studying institutional ownership for a company can add value to your research, it is also a good practice to research analyst recommendations to get a deeper understand of a stock's expected performance. There are a reasonable number of analysts covering the stock, so it might be useful to find out their aggregate view on the future.
Insider Ownership Of Ameriprise Financial
The definition of company insiders can be subjective and does vary between jurisdictions. Our data reflects individual insiders, capturing board members at the very least. The company management answer to the board and the latter should represent the interests of shareholders. Notably, sometimes top-level managers are on the board themselves.
Most consider insider ownership a positive because it can indicate the board is well aligned with other shareholders. However, on some occasions too much power is concentrated within this group.
Our information suggests that Ameriprise Financial, Inc. insiders own under 1% of the company. As it is a large company, we'd only expect insiders to own a small percentage of it. But it's worth noting that they own US$91m worth of shares. It is always good to see at least some insider ownership, but it might be worth checking if those insiders have been selling.
General Public Ownership
The general public-- including retail investors -- own 11% stake in the company, and hence can't easily be ignored. This size of ownership, while considerable, may not be enough to change company policy if the decision is not in sync with other large shareholders.
Next Steps:
I find it very interesting to look at who exactly owns a company. But to truly gain insight, we need to consider other information, too.
I like to dive deeper into how a company has performed in the past. You can access this interactive graph of past earnings, revenue and cash flow, for free.
But ultimately it is the future, not the past, that will determine how well the owners of this business will do. Therefore we think it advisable to take a look at this free report showing whether analysts are predicting a brighter future.
NB: Figures in this article are calculated using data from the last twelve months, which refer to the 12-month period ending on the last date of the month the financial statement is dated. This may not be consistent with full year annual report figures.
Have feedback on this article? Concerned about the content? Get in touch with us directly. Alternatively, email editorial-team (at) simplywallst.com.
This article by Simply Wall St is general in nature. We provide commentary based on historical data and analyst forecasts only using an unbiased methodology and our articles are not intended to be financial advice. It does not constitute a recommendation to buy or sell any stock, and does not take account of your objectives, or your financial situation. We aim to bring you long-term focused analysis driven by fundamental data. Note that our analysis may not factor in the latest price-sensitive company announcements or qualitative material. Simply Wall St has no position in any stocks mentioned.