
- LIVE QUOTES
- LEARN
- HELP
 Wall Street Journal
EN
Top European Dividend Stocks To Consider In May 2025
As European markets face increased volatility due to renewed tariff threats from the U.S., major stock indexes have experienced declines, with the pan-European STOXX Europe 600 Index snapping a five-week streak of gains. In this climate of economic uncertainty and shifting trade policies, dividend stocks can offer investors a measure of stability and income, making them an attractive option for those looking to navigate these turbulent times.
Top 10 Dividend Stocks In Europe
| Name | Dividend Yield | Dividend Rating |
| Bredband2 i Skandinavien (OM:BRE2) | 4.33% | ★★★★★★ |
| Julius Bär Gruppe (SWX:BAER) | 4.82% | ★★★★★★ |
| Allianz (XTRA:ALV) | 4.37% | ★★★★★★ |
| Zurich Insurance Group (SWX:ZURN) | 4.34% | ★★★★★★ |
| Rubis (ENXTPA:RUI) | 6.95% | ★★★★★★ |
| Deutsche Post (XTRA:DHL) | 4.78% | ★★★★★★ |
| ERG (BIT:ERG) | 5.60% | ★★★★★★ |
| HEXPOL (OM:HPOL B) | 4.74% | ★★★★★★ |
| OVB Holding (XTRA:O4B) | 4.46% | ★★★★★★ |
| Banque Cantonale Vaudoise (SWX:BCVN) | 4.48% | ★★★★★★ |
Click here to see the full list of 231 stocks from our Top European Dividend Stocks screener.
Let's take a closer look at a couple of our picks from the screened companies.
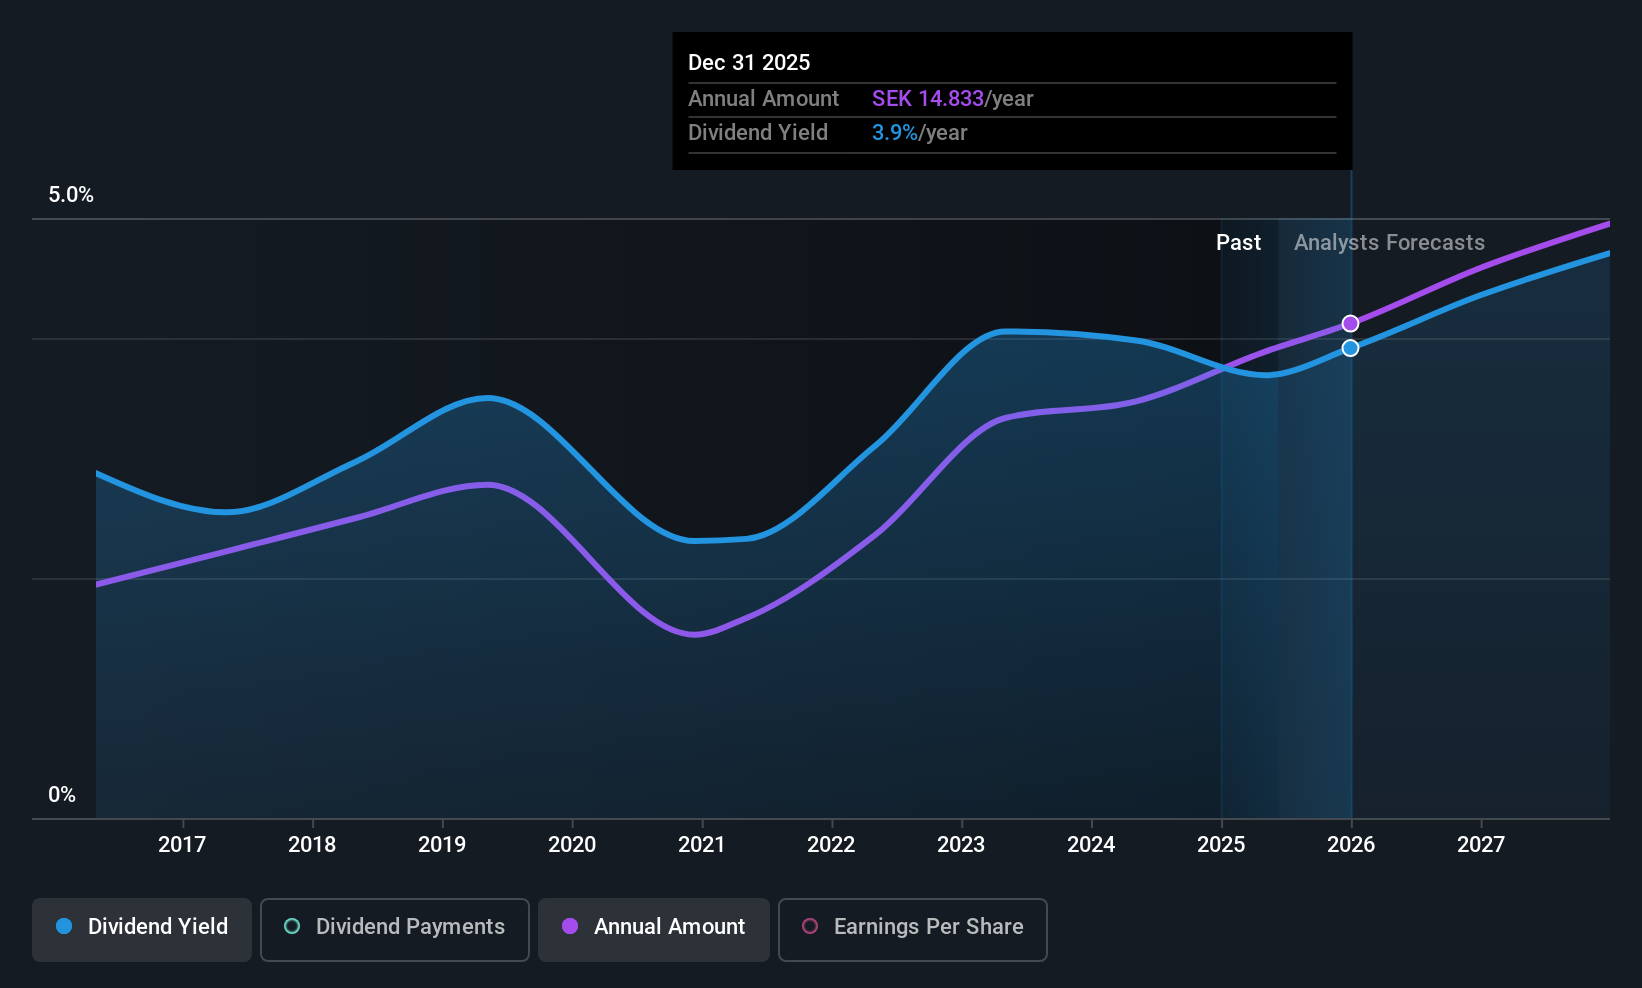
Loomis (OM:LOOMIS)
Simply Wall St Dividend Rating: ★★★★☆☆
Overview: Loomis AB (publ) offers secure payment solutions across the United States, France, Switzerland, Spain, the United Kingdom, Sweden, and other international markets with a market cap of SEK26.11 billion.
Operations: Loomis AB (publ) generates revenue through its segments: SME/Pay at SEK120 million, Europe and Latin America at SEK14.91 billion, and the United States of America (USA) at SEK16 billion.
Dividend Yield: 3.7%
Loomis offers a mixed picture for dividend investors. While its dividend payments have been volatile over the past decade, recent increases to SEK 14 per share indicate growth potential. The company's payout ratio of 58.2% shows dividends are well-covered by earnings and cash flows, with a low cash payout ratio of 22.1%. Despite trading at good value compared to peers, Loomis's dividend yield is slightly below top-tier levels in Sweden. Recent earnings growth and strategic financial moves enhance its investment profile.
- Unlock comprehensive insights into our analysis of Loomis stock in this dividend report.
- Our expertly prepared valuation report Loomis implies its share price may be lower than expected.
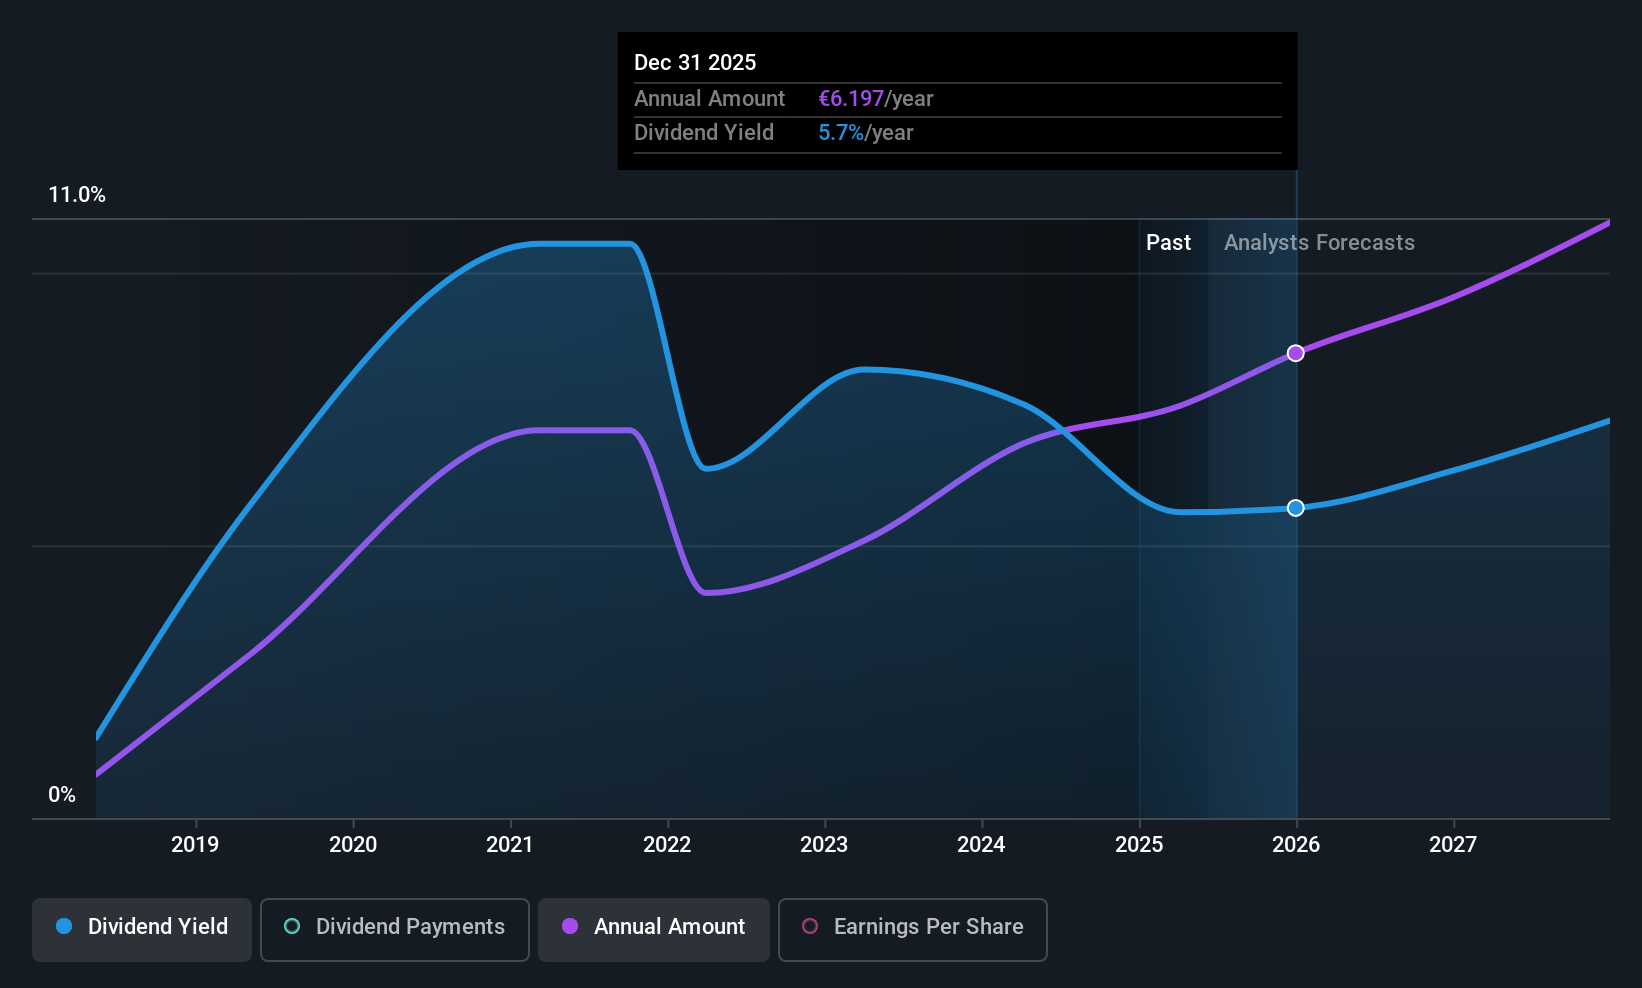
BAWAG Group (WBAG:BG)
Simply Wall St Dividend Rating: ★★★★☆☆
Overview: BAWAG Group AG operates as a holding company for BAWAG P.S.K. and has a market cap of €8.54 billion.
Operations: BAWAG Group AG generates revenue primarily through its Retail & SME segment (€1.23 billion) and the Corporates, Real Estate & Public Sector segment (€323.50 million), with additional contributions from Treasury (€59 million) and Corporate Center (€56 million).
Dividend Yield: 5.1%
BAWAG Group's dividend yield ranks among the top 25% in Austria, though its track record is less stable with payments over seven years. The proposed €5.50 per share dividend for 2024 reflects growth but past volatility persists. With a payout ratio of 58.5%, dividends are currently well-covered by earnings and expected to remain sustainable, aligning with forecasts of net profit exceeding €800 million for 2025. Trading below estimated fair value enhances its investment appeal despite historical inconsistencies in dividend reliability.
- Delve into the full analysis dividend report here for a deeper understanding of BAWAG Group.
- Our comprehensive valuation report raises the possibility that BAWAG Group is priced higher than what may be justified by its financials.
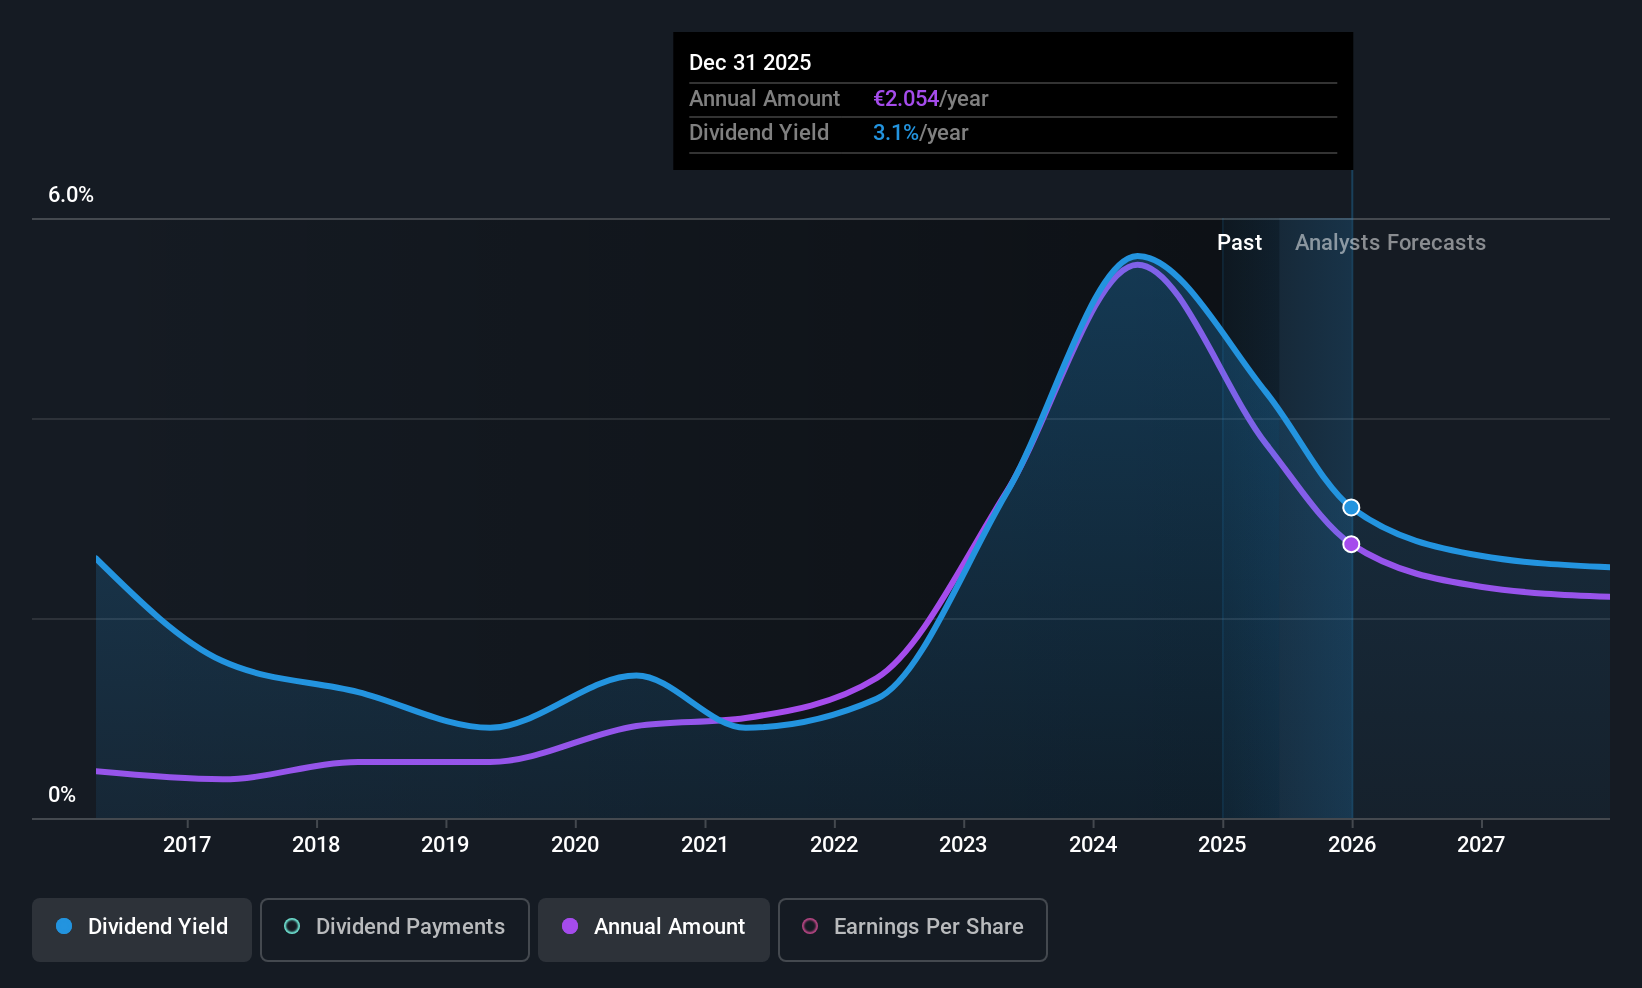
VERBUND (WBAG:VER)
Simply Wall St Dividend Rating: ★★★★☆☆
Overview: VERBUND AG, with a market cap of €23.57 billion, generates, trades, and sells electricity to energy exchange markets, traders, electric utilities and industrial companies, as well as households and commercial customers through its subsidiaries.
Operations: VERBUND AG's revenue is primarily derived from its segments in Sales (€6.96 billion), Hydro (€3.36 billion), Grid (€1.59 billion), and New Renewables (€335.20 million).
Dividend Yield: 4.1%
VERBUND's dividend of €2.80 per share, payable on May 19, 2025, reflects a decrease and is considered low compared to top Austrian payers. Despite a reasonable payout ratio (55.1%) and cash payout ratio (56.3%), ensuring coverage by earnings and cash flows, the dividend has been volatile over the past decade with significant annual drops. Recent Q1 2025 results showed decreased net income (€396.7 million) despite increased sales (€2.20 billion), highlighting potential challenges in sustaining dividends amidst expected earnings declines.
- Take a closer look at VERBUND's potential here in our dividend report.
- Our valuation report here indicates VERBUND may be overvalued.
Key Takeaways
- Reveal the 231 hidden gems among our Top European Dividend Stocks screener with a single click here.
- Are any of these part of your asset mix? Tap into the analytical power of Simply Wall St's portfolio to get a 360-degree view on how they're shaping up.
- Maximize your investment potential with Simply Wall St, the comprehensive app that offers global market insights for free.
Want To Explore Some Alternatives?
- Explore high-performing small cap companies that haven't yet garnered significant analyst attention.
- Fuel your portfolio with companies showing strong growth potential, backed by optimistic outlooks both from analysts and management.
- Find companies with promising cash flow potential yet trading below their fair value.
This article by Simply Wall St is general in nature. We provide commentary based on historical data and analyst forecasts only using an unbiased methodology and our articles are not intended to be financial advice. It does not constitute a recommendation to buy or sell any stock, and does not take account of your objectives, or your financial situation. We aim to bring you long-term focused analysis driven by fundamental data. Note that our analysis may not factor in the latest price-sensitive company announcements or qualitative material. Simply Wall St has no position in any stocks mentioned.
Have feedback on this article? Concerned about the content? Get in touch with us directly. Alternatively, email editorial-team@simplywallst.com