
- LIVE QUOTES
- LEARN
- HELP


EN
Cui Dongshu: In January-April, China's automobile exports reached 2.16 million vehicles, a year-on-year growth rate of 15%
The Zhitong Finance App learned that on May 23, Cui Dongshu published an article stating that in January-April 2025, China's automobile exports reached 2.16 million vehicles, a 15% increase from January to April 2024, and that in April, China's automobile exports reached 620,000 vehicles, up 12% year on year, 36% month on month, and the month-on-month trend is generally strong; the main driving force this year is still improving the competitiveness of Chinese products and slight growth in the global southern market, but the cycle of international brands in the Russian market being completely replaced by Chinese cars under the Russian-Ukrainian crisis is likely to end, and the decline is huge.
The top 10 countries with total automobile exports in April 2025: Mexico 49,139 vehicles, Brazil 4,104, Russia 3,2406, United Arab Emirates 31,146, Australia 29,965, United Kingdom 26,421, Belgium 25,3636, Philippines 23,672, Saudi Arabia 23084, Malaysia 18,237; the top five countries where China's automobile exports increased in April: the Philippines 10,871, Mexico 10024, Indonesia 9311, Kazakhstan 6933, Malaysia 58,8080.
Chinese car companies in the Russian market are becoming more aware of risk prevention. Although sales in Russia did not decline much in January-April, our exports to Russia declined significantly from January to April 2025.
The top 10 countries with cumulative total vehicle exports in 2025: Mexico 18,7782, UAE 13,9054, Russia 131,739, Belgium 93992, Brazil 93,539, Saudi Arabia 91985, Australia 90,906, United Kingdom 78241, Philippines 70745, Turkey 54703; the top five countries with annual increase in China's automobile exports: the United Arab Emirates 52421, Mexico 38,224, Australia 24,324, Indonesia 23,317, Kazakhstan 20570 vehicle. The incremental contribution of the top 5 countries was 62%, with UAE exports contributing a huge amount. Markets such as Russia, Brazil, and the United Kingdom declined significantly in 2025. In 2025, the Middle East market became an incremental core market.
Top 10 countries with total NEV exports in April 2025: Brazil 34,802, Belgium 24,713, Mexico 2,1513, UK 18,529, Philippines 18,407, Australia 16,464, Thailand, 10688, Turkey, 10688, Indonesia, 8754, Spain; the top five countries where China's NEV exports increased in April 2025 compared to April 2024: Mexico 14,135, the Philippines 11070, Turkey 9072, and Indonesia 6710, Australia 4105.
Top 10 countries with total NEV exports from January to April 2025: Belgium 89,273, Mexico 70,275, Brazil 70035, Philippines 51,778, UK 51269, Thailand 43776, Turkey 42919, Australia 42387, UAE 29245, India 2,7043; top five countries where China's NEV exports increased from January to April 2025 compared to January to April 2024: Mexico 49,586, Turkey 35079, Israel 14,643 , Indonesia: 14,232; Philippines: 13,664.
In 2025, exports to Southeast Asia such as Belgium, Mexico, Brazil, and Thailand are some of the main directions. Recently, exports to markets such as Brazil, Russia, and Canada have been weak. Non-EU European countries and two types of markets, India and Malaysia, performed well.
China's NEV export performance from January to April 2025 was better than expected. China's NEV exports to the Middle East and developed markets showed high quality development, mainly to Western Europe and Asia. The Russian decline in the fuel vehicle market is fully reflected, and the decline in retail sales volume in the Russian market we are monitoring is small. Among them, major car companies such as BYD (01211), Geely (00175), and Changan (000625.SZ) performed very well.
I. Overall trend of China's automobile exports
1. Trends in automobile exports over the years
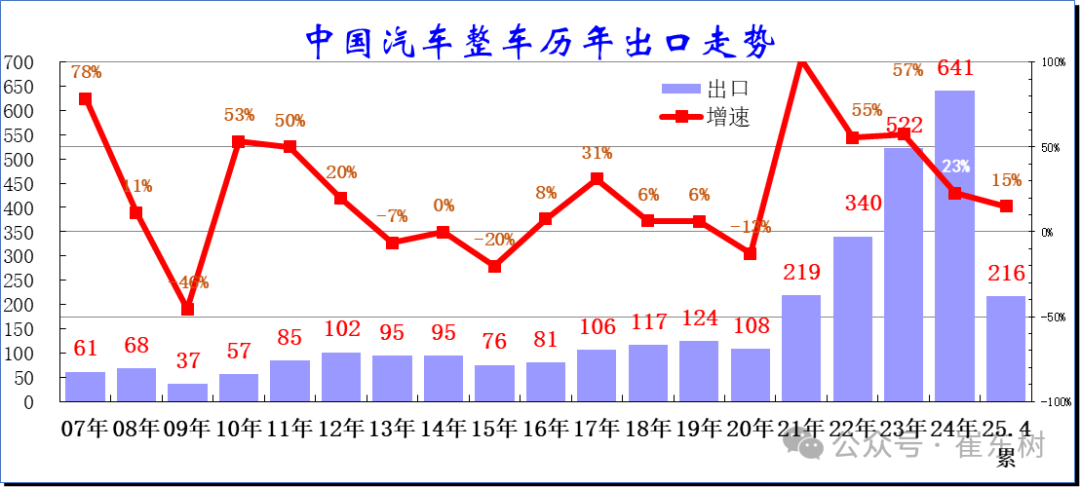
China's automobile exports finally broke through the million-level platform period in 2021 after many years. After a sharp decline due to the downturn in the world economy in 2013-2016, the export growth rate gradually improved steadily in 2017-2020, and the annual export volume remained at around 1 million vehicles. Exports in 2020 reached 1.08 million vehicles, down 13% year on year, and then entered a period of high growth.
Due to the impact of the world pandemic and Tesla's domestic production, China's automobile exports achieved huge sales volume and unit price breakthroughs in 2021-2023. In 2023, China achieved 5.22 million automobile exports, and the export growth rate continued to grow strongly by 57%. For the full year of 2024, China exported 6.41 million vehicles, an increase of 23% over the previous year. From January to April 2025, China recently exported 2.16 million vehicles, with a 15% export growth rate. Recently, Chinese automobiles have grown rapidly. As long as there is a stable international market environment in the future, it is expected that there will still be huge room for the development of Chinese automobile exports.
Sales for the full year of 2020 reached 1.08 million units, down 13.1% year on year. The export market sold 2.187 million vehicles in 2021, an increase of 102% over the previous year.
The export market sold 3.4 million vehicles in 2022, an increase of 55% over the previous year, mainly due to insufficient overseas supply and a significant increase in the export competitiveness of Chinese car companies. In 2023, China achieved exports of 5.22 million vehicles, with a sustained strong export growth rate of 54%. The performance was excellent. Compared with the gradual recovery in domestic automobile sales, the export market's performance is still excellent. China's exports have grown significantly in the past two years under the international pandemic+Russia-Ukraine crisis.
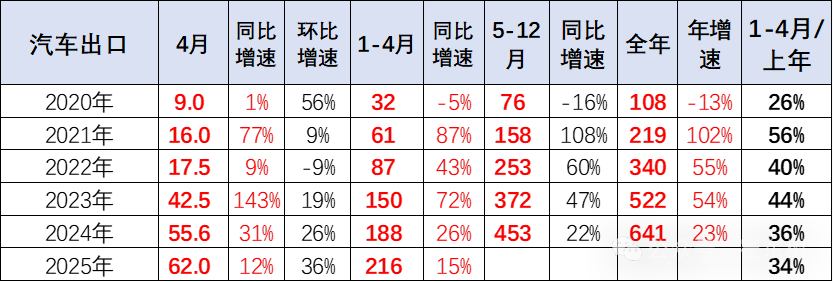
From January to April 2025, China achieved exports of 2.16 million vehicles, a 15% growth rate from January to April 2024, and 620,000 vehicles in April, up 12% year on year and 36% month on month, and the year-on-month trend is generally strong. The main driving force this year is still the improvement in the competitiveness of Chinese products and a slight increase in the global market in southern countries, but the cycle of international brands in the Russian market being completely replaced by Chinese cars under the Russian-Ukrainian crisis is likely to end, and the decline is huge.
2. Monthly trend of vehicle exports
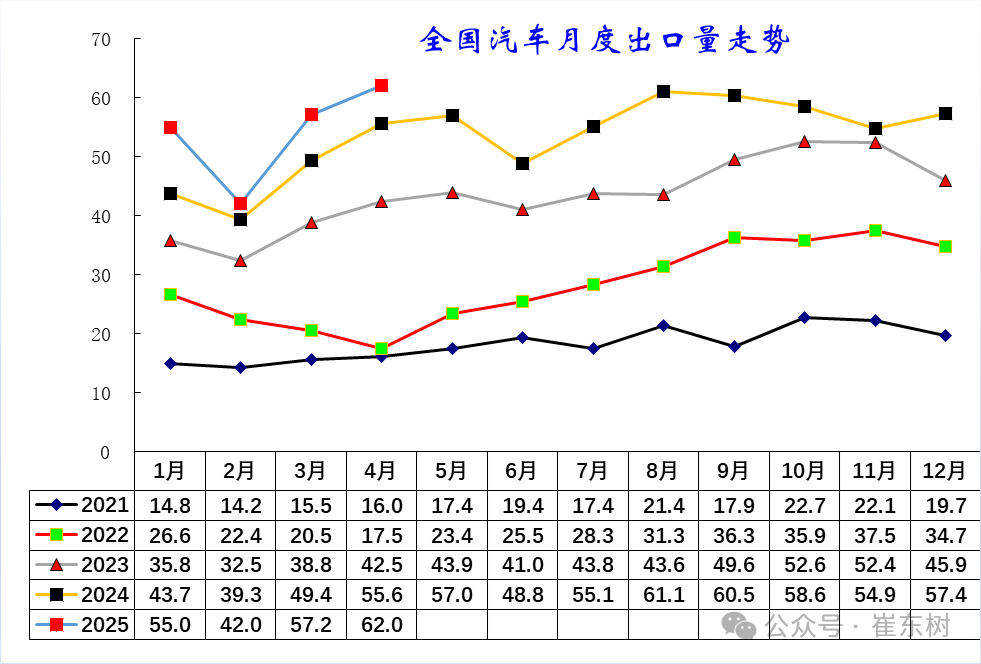
Judging from monthly trends, exports in recent years are still showing seasonal characteristics, showing the contrast between rising summer and domestic trends. The auto market had a strong start in 2022, but exports declined month-on-month in February-April, which was affected by the Shanghai epidemic, and continued to rise in May-December. Exports continued to be strong in 2023. China's automobile exports throughout 2024 are basically in line with the gradual strengthening trend of previous years.
The growth rate in January 2025 was relatively strong. In February-April, the growth rate of China's automobile exports was less affected by the imposition of tariffs by Trump.
3. Structural characteristics of automobile exports
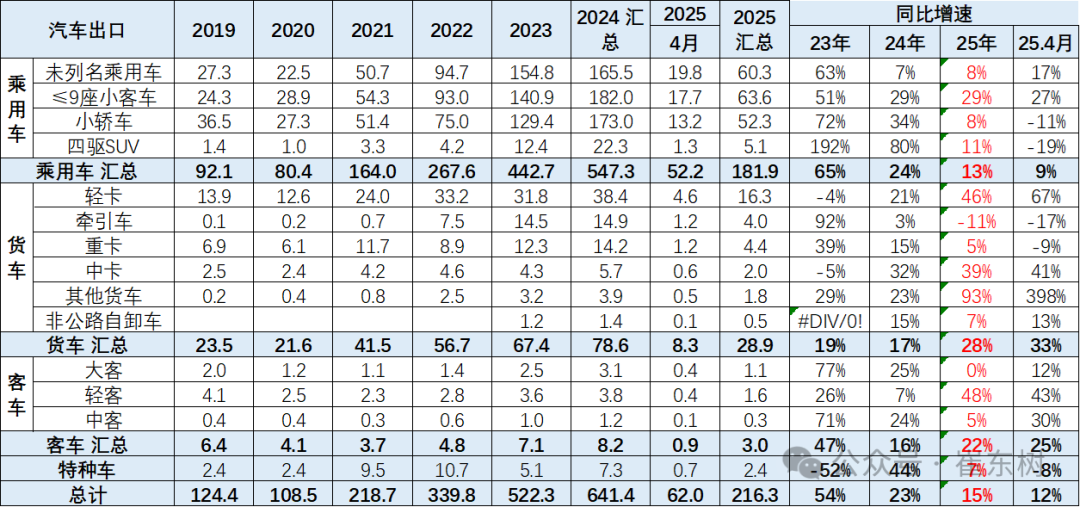
Until 2020, China's automobile exports remained at the level of one million. Subsequently, it continued to grow rapidly to 6.41 million vehicles in 2024. Among them, passenger car exports continued to strengthen, and truck and bus exports also continued to grow relatively well.
In January-April of this year, the growth rate of all types of customs models diverged, and the growth rate of trucks and buses was better than 2024. In particular, truck exports increased by 28%. Compared with the slump in domestic trucks, light trucks and medium trucks have recently been relatively good, and exports of heavy truck tractors have stabilized.
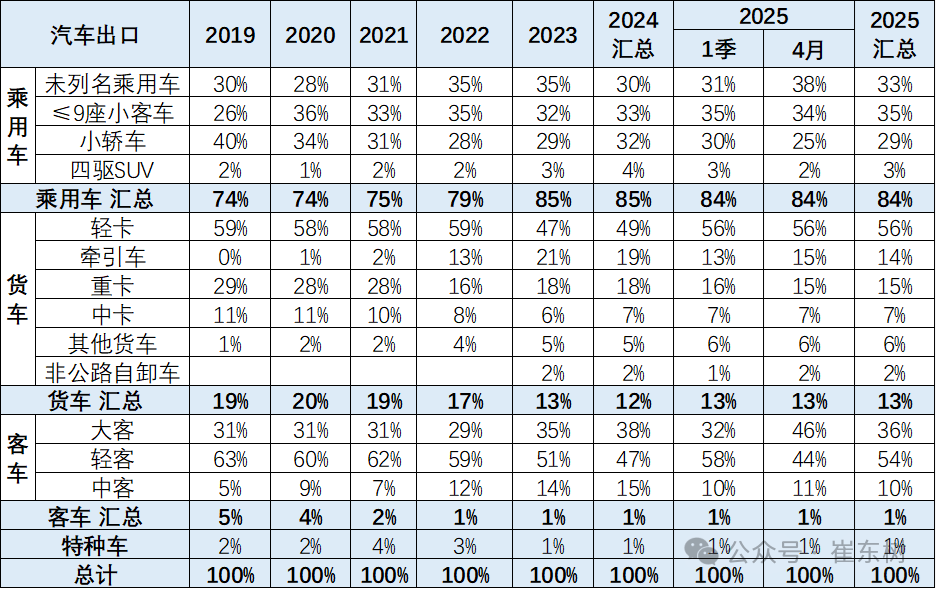
In terms of structure, the share of passenger car exports continued to rise to 85% in 2023, and was relatively stable thereafter. The share of exports of trucks and buses continues to fall to a low level. Since passenger cars are the focus of trade, the proportion of trucks and buses exported is still slightly higher than that of domestic commercial vehicles.
The performance of several major models within passenger cars was more balanced. The improvement in performance in 2025 was the export of unlisted passenger cars. Although the decline in Tesla exports had a big impact, autonomous small and mini electric vehicles grew better. In 2025, the proportion of buses with 9 seats or less was 35%, of which in April it reached 34%.
Trucks showed strong performance in April. Among them, light trucks showed good growth performance, and heavy truck export performance declined. Among buses, large and medium-sized buses are average, and light bus exports are slightly stronger.
4. Structural characteristics of export dynamics
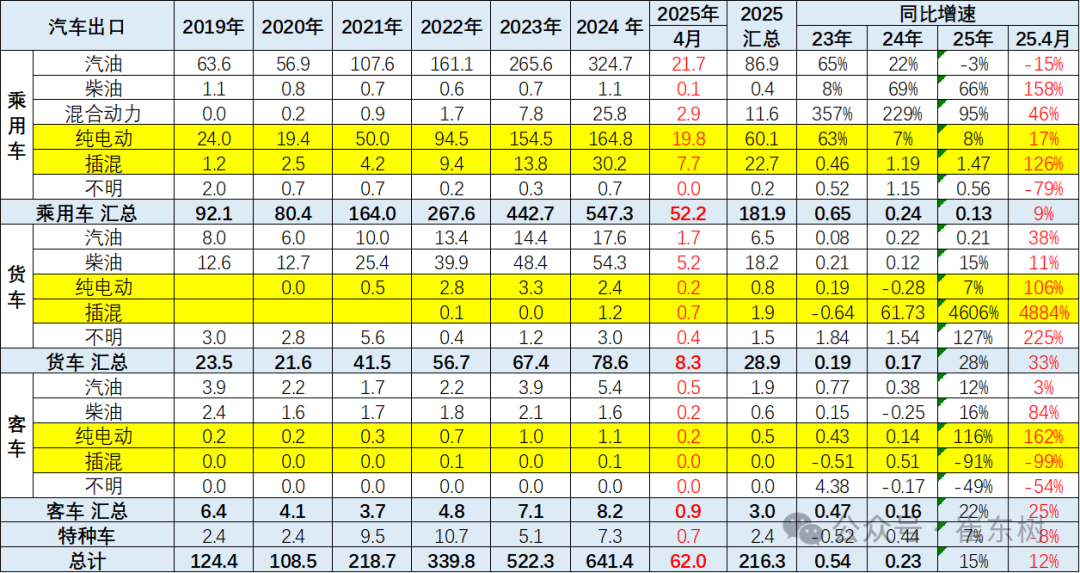
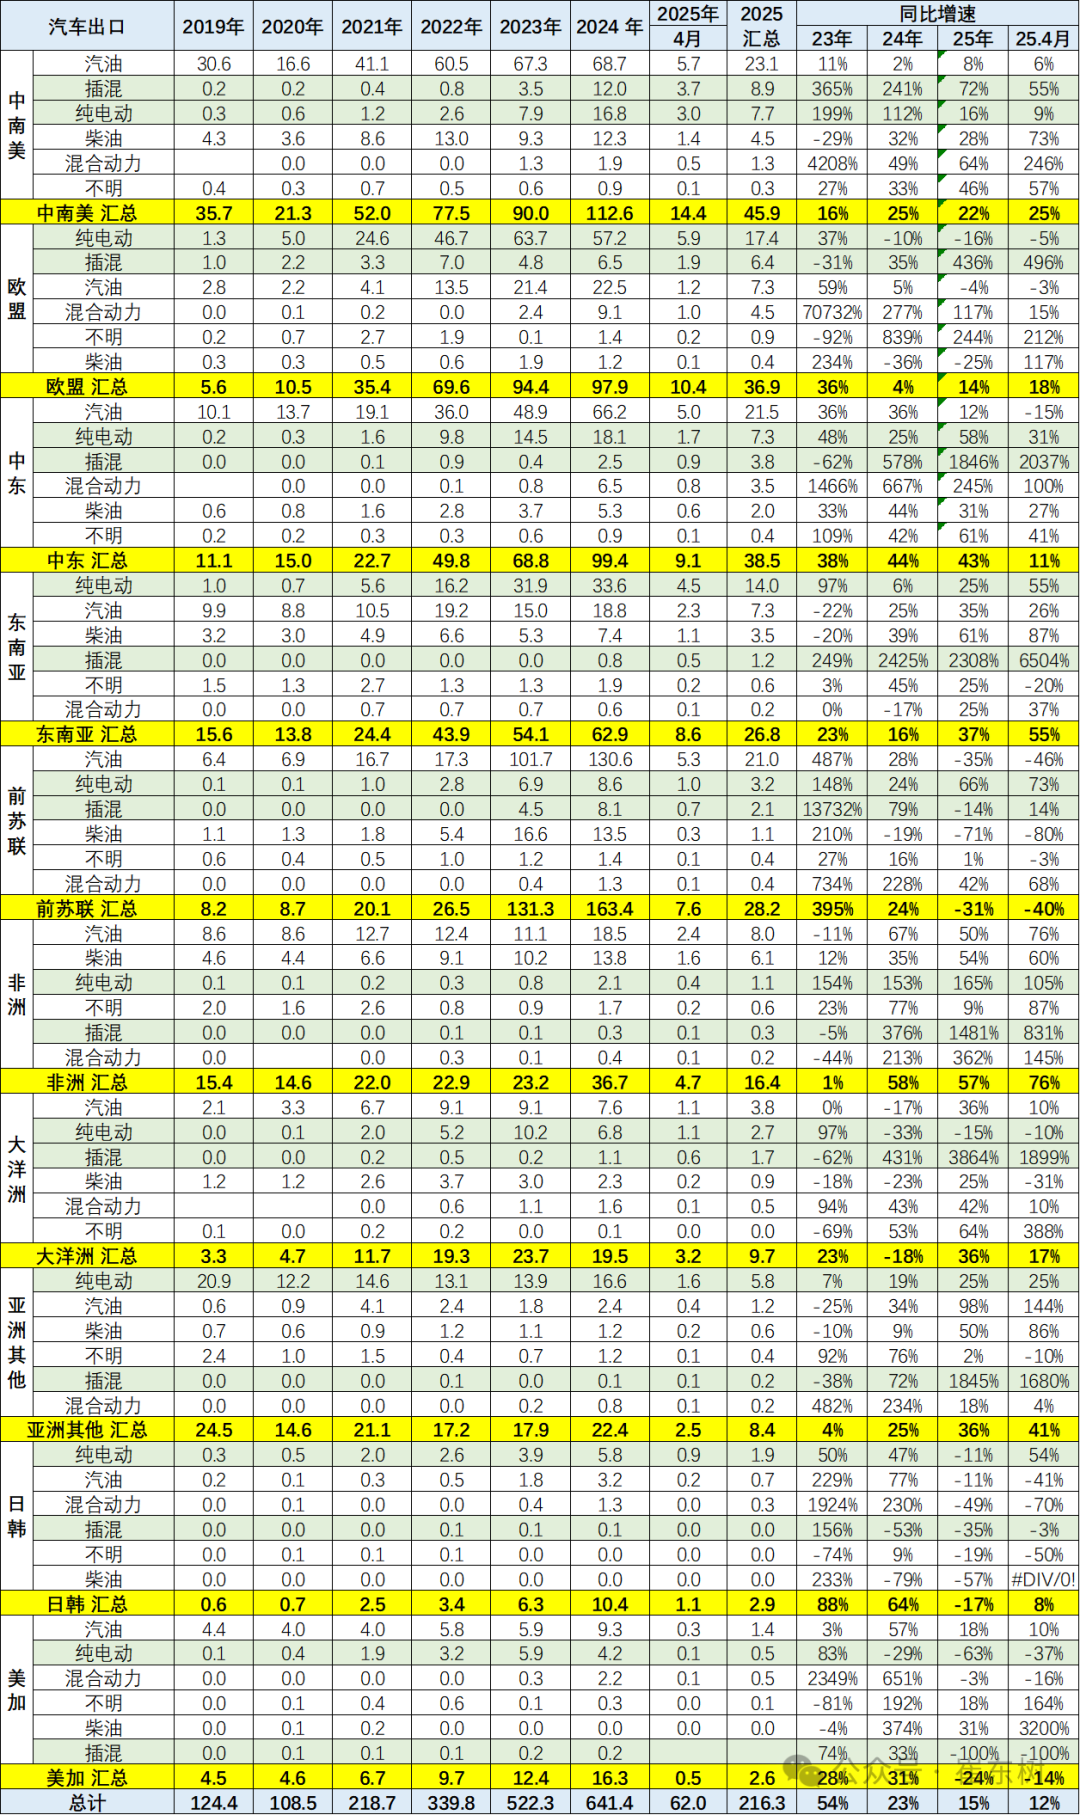
The export growth rate of passenger cars declined significantly in 2025. Among them, exports of gasoline vehicles and pure electric vehicles both had low growth rates, and both declined in April. The export of hybrid passenger cars was strong this year, with plug-in exports growing the strongest. Truck and bus exports have been stable this year, and passenger cars are the core volatile variable for exports to Russia and Europe.
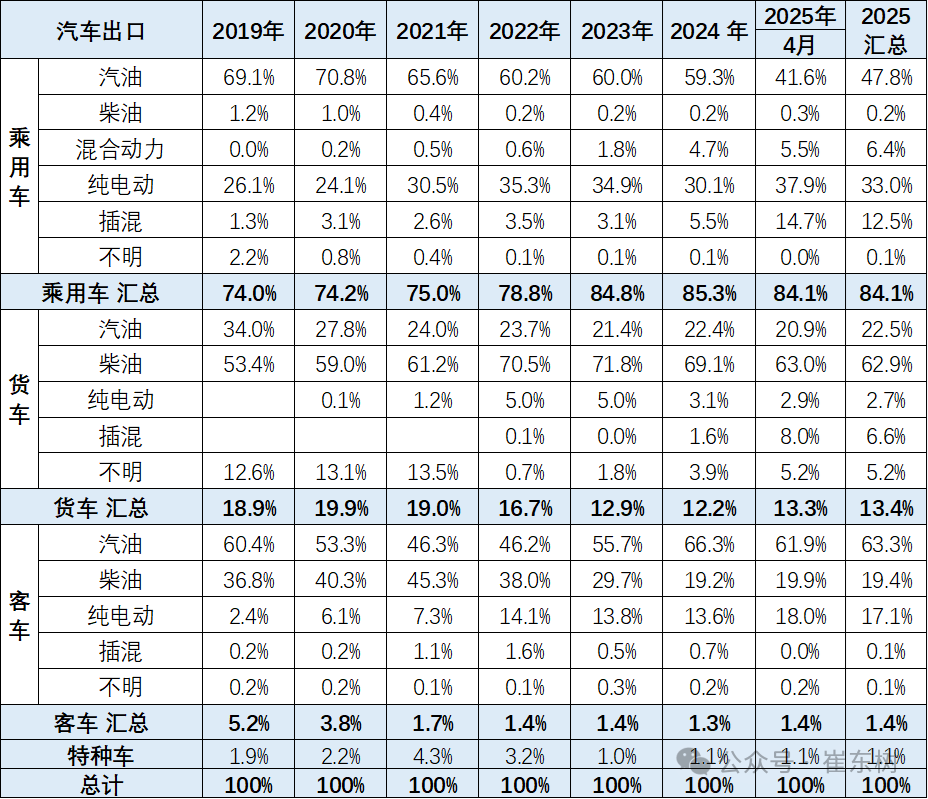
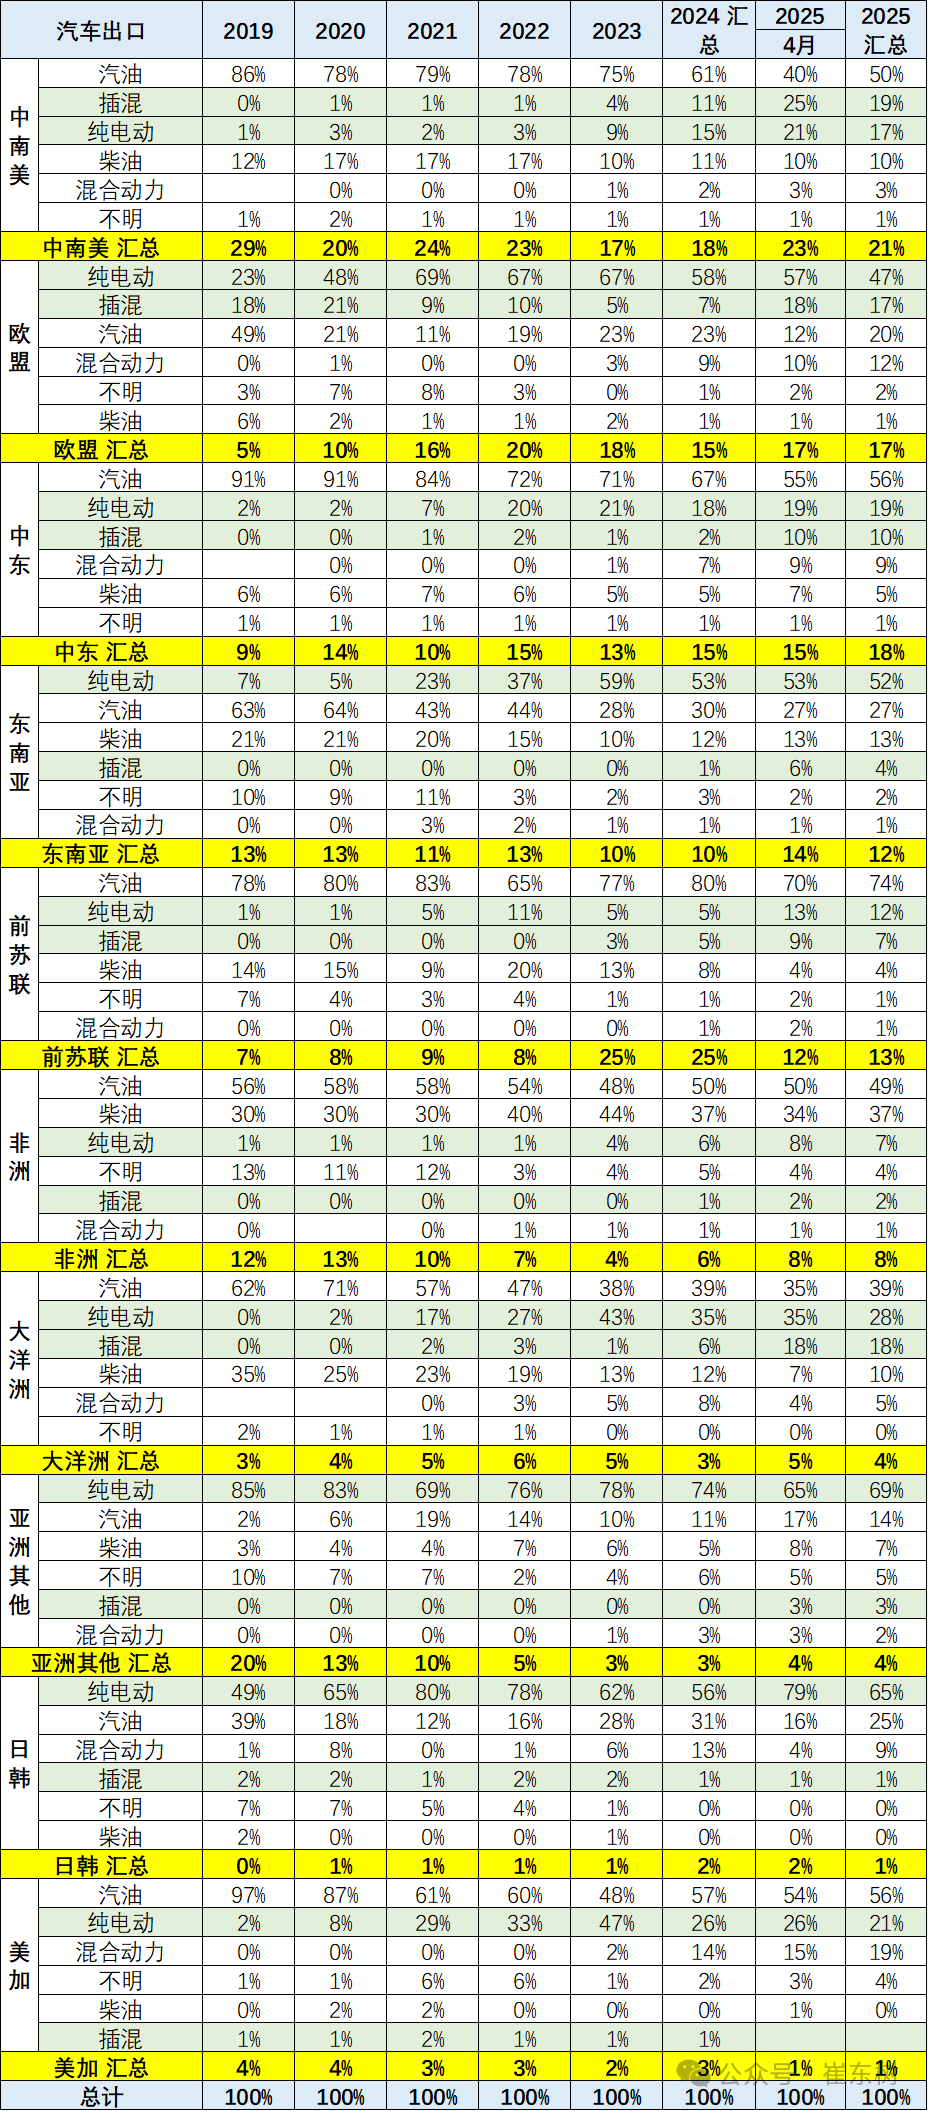
The share of pure electric passenger cars rebounded from January to April 2025, and exports of gasoline passenger cars and gasoline buses declined significantly. Among them, exports of pure electric passenger cars rebounded sharply from month to month in April.
II. The pattern of the automobile export market
1. Domestic regional characteristics of export manufacturers
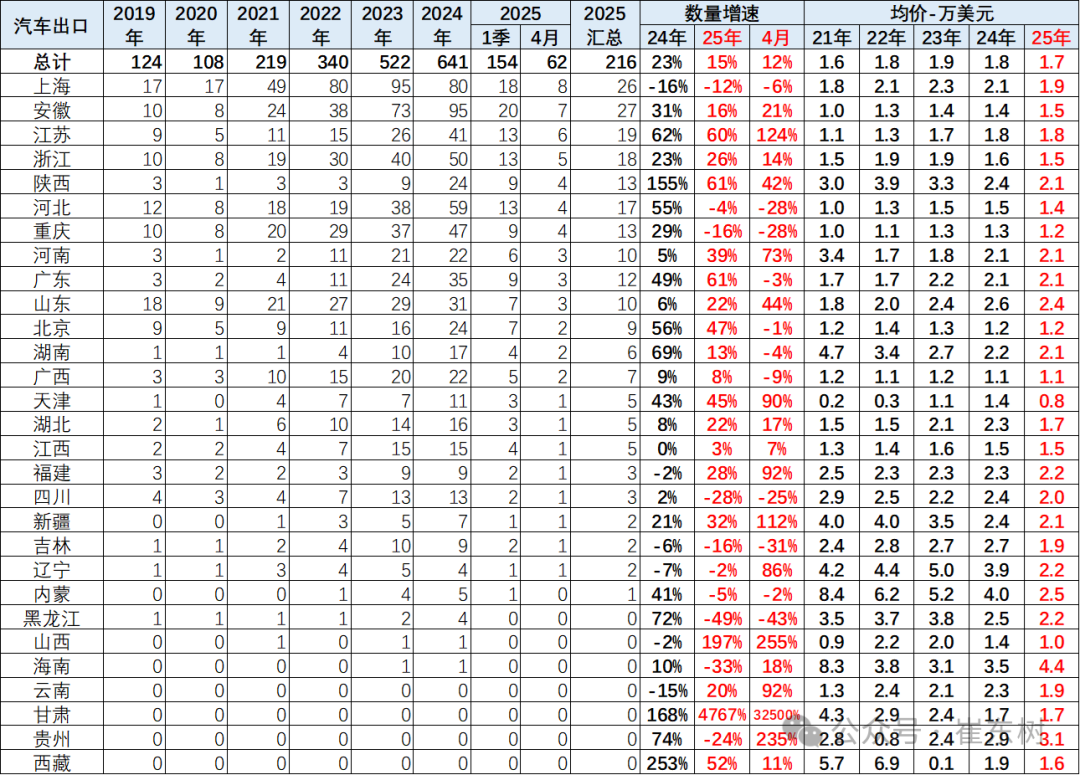
In 2024, the leading position of automobile exports from Shanghai was replaced by Anhui, but in 2025, Anhui remained the number one exporter. The importance of Shanghai's exports to China is extremely obvious. In 2025, Shanghai Motors exported 260,000 vehicles. This is mainly due to the relatively excellent local companies in Shanghai, in particular, SAIC Motor and Tesla (TSLA.US), which had relatively strong export volumes in April.
Anhui's export performance has been relatively strong in the past two years. Mainly, the export performance of Chery and Jianghuai (600418.SH) is relatively strong, but Russia's risk is huge, so Anhui's export diversification is good. The contribution of automobile exports from Shaanxi and Jiangsu increased significantly in 2025.
2. Export area characteristics
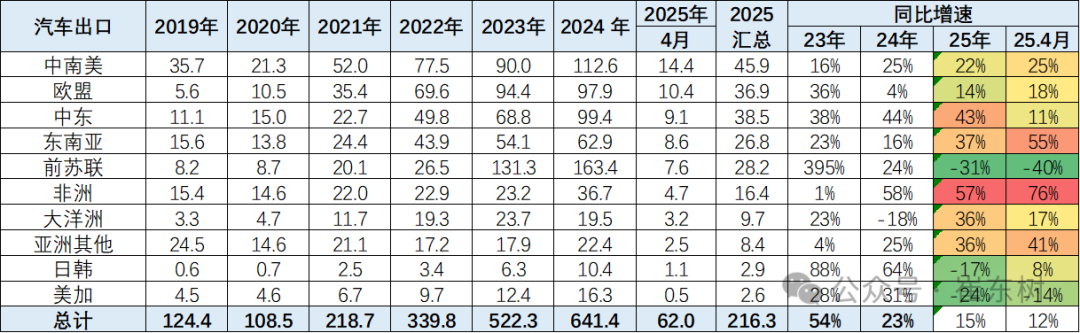
The overall performance of China's automobile exports was strong. Among them, exports to the Middle East, Africa, and Oceania performed relatively well. Meanwhile, there is a lot of pressure on export performance from the former Soviet Union region, the US, Canada, Japan, and South Korea.
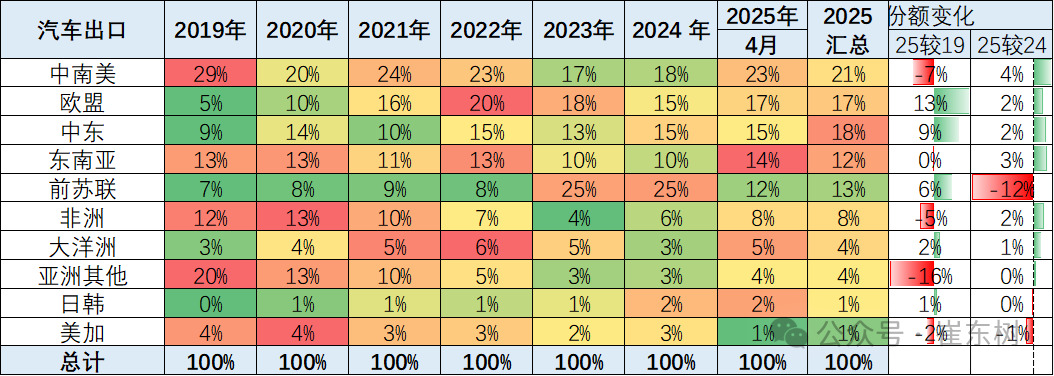
China's automobile exports have gradually moved from having a high share of Central and South America and strong performance in other regions of Asia, such as Southeast Asia and South Asia, to the present characteristics of relatively strong performance in Central and South America and the Middle East. Especially recently, the Middle East, Central and South America have all performed relatively well compared to last year, and the main decline was in the former Soviet Union region, which dropped from 25% last year's share to 13% this year.
3. Analysis of export subregion segmentation trends
Exports to the former Soviet Union fell sharply from January to April 2025, as did pure electric exports to Europe, the US and Canada. However, it is still relatively good for regions such as Africa, the Middle East, Oceania, and the Middle East. Growth in 2025 is the result of exploring markets such as Australia and Southeast Asia.
In terms of sales volume, exports in 2017-2022 showed a gradual upward trend, mainly due to European contributions. After 2024, the Russian market grew significantly and became the core growth. Russia's share declined in 2025, and exports from Latin America and the Middle East increased.
Recently, there will be a sharp decline in the Russian market, while the developed markets in Europe and North America will decline slightly, and the market performance of developed countries will decline. The performance of South America's new energy exports fluctuated greatly. Export demand from poor and backward parts of the world is unstable, but China's automobile competition continues to rise and will continue to grow in the future.
4. Analysis of vehicle export trends by country
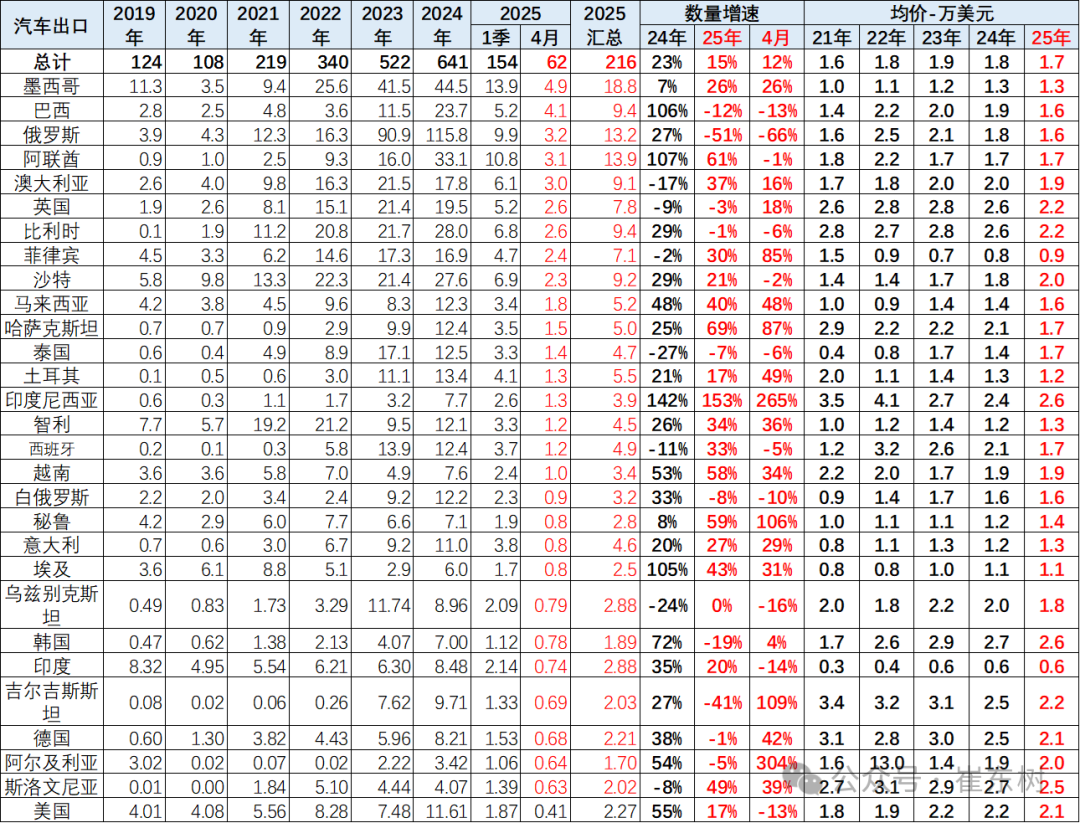
The average export price in 2021 was 16,000 US dollars, the average price of automobile exports was 18,000 US dollars in 2022, and rose to 19,000 US dollars in 2023, showing continuous upward characteristics. The average export price was 18,000 US dollars in 2024 and 17,000 US dollars in 2025. The average export price continued to fall, and the decline in Tesla's share of exports brought down the average price of bicycles.
The Russian market changed dramatically in the early stages, and other foreign investors withdrew, so China's exports to Russia have also been high since 2023. In 2024, the Russian performance of Chinese car companies is still strong, and it may return to full competition this year. Last year, more cars were exported to Belgium. Relations with Europe have improved this year, and export performance has also improved.
The recent strong performance of the Mexican market has been strong, and April has not yet been affected by the increase in European and American taxes. Auto markets in Chile, Peru, Thailand, etc. plummeted earlier, but have recovered this year. Asia is still a better market for Saudi Arabia and the UAE.
5. Monthly trend of increase or decrease in vehicle exports
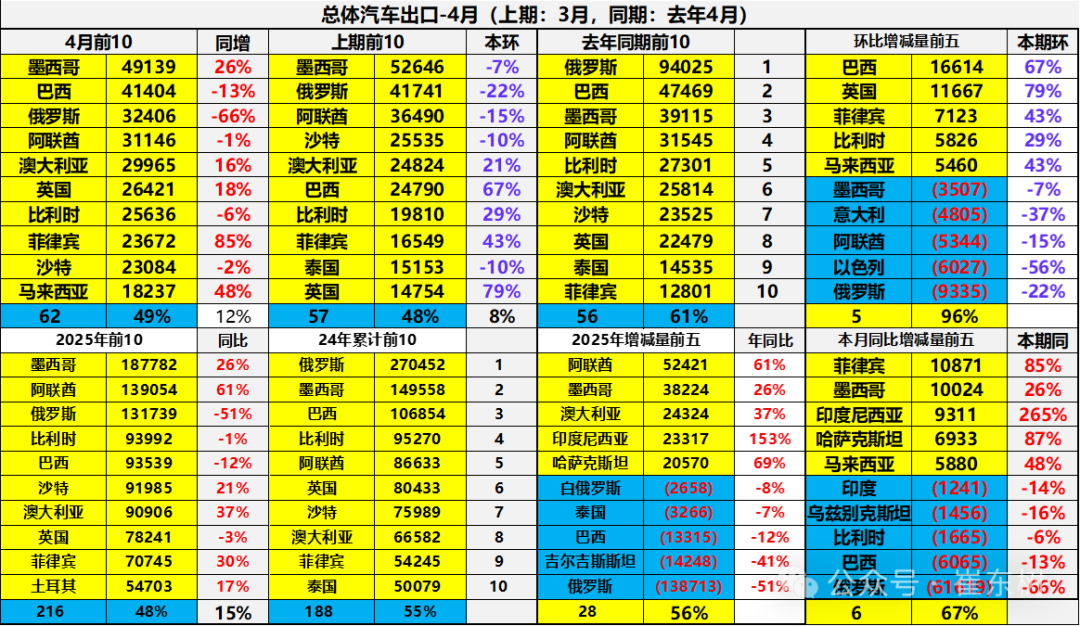
The top 10 countries with total automobile exports in April 2025: Mexico 49,139 vehicles, Brazil 4,104, Russia 3,2406, United Arab Emirates 31,146, Australia 29,965, United Kingdom 26,421, Belgium 25,3636, Philippines 23,672, Saudi Arabia 23084, Malaysia 18,237; the top five countries where China's automobile exports increased in April: the Philippines 10,871, Mexico 10024, Indonesia 9311, Kazakhstan 6933, Malaysia 58,8080.
Chinese car companies in the Russian market are becoming more aware of risk prevention. Although sales in Russia did not decline much in January-April, our exports to Russia declined significantly from January to April 2025.
The top 10 countries with cumulative total vehicle exports in 2025: Mexico 18,7782, UAE 13,9054, Russia 131,739, Belgium 93992, Brazil 93,539, Saudi Arabia 91985, Australia 90,906, United Kingdom 78241, Philippines 70745, Turkey 54703; the top five countries with annual increase in China's automobile exports: the United Arab Emirates 52421, Mexico 38,224, Australia 24,324, Indonesia 23,317, Kazakhstan 20570 vehicle. The incremental contribution of the top 5 incremental countries was 56%, with UAE exports contributing a huge amount. Markets such as Russia, Brazil, and Thailand declined significantly in 2025. In 2025, the Middle East market became an incremental core market.
6. Analysis of changes in major exporting countries over the years

Overseas base results for automobile exports in the early stages were not ideal. Automobile exports in 2020 were mainly achieved in Saudi Arabia, Bangladesh, Egypt, Chile, etc., with sharp fluctuations.
The main automobile export markets in 2022 come from Mexico, Saudi Arabia, Chile, Belgium, Australia, the Philippines, Russia, etc., with many underdeveloped countries.
The main markets for automobile exports in 2023-2024 come from countries such as Russia, Mexico, Belgium, Australia, Saudi Arabia, and the United Kingdom, with strong trends in the European and American markets. Recently, performance has improved compared to developed countries such as Australia, Belgium, and the United Kingdom.
The structure of automobile exports changed from January to April 2025, and Mexico rose to the leading export position. Exports to Russia fell to 3rd place in April, and exports from the UAE and Saudi Arabia increased. Australia's exports have recovered, and Brazil's exports have increased year over year.
7. Analysis of changes in exports to Russia
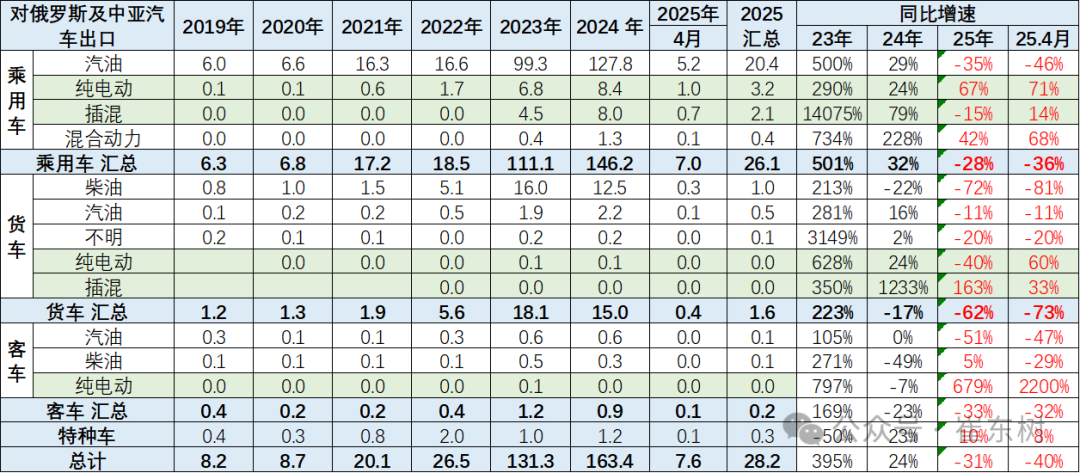
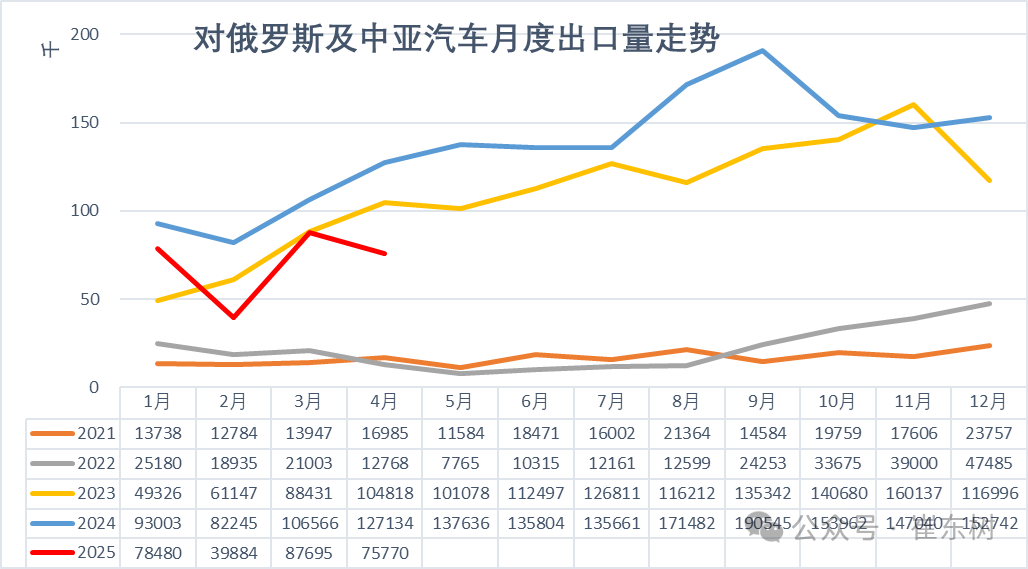
In 2022, China exported 265,000 vehicles to Russia and Central Asia, and in 2023, China exported 1,313 million vehicles to Russia and Central Asia, an increase of 395% over the previous year. In 2024, China exported 1.634 million vehicles to Russia and Central Asia, an increase of 24% over the previous year. From January to April 2025, China exported 282,000 vehicles to Russia and Central Asia, a year-on-year decrease of 31%.
Since 2023, Russia has suddenly become the largest market for Chinese automobile exports. This is another dramatic change in Chinese automobile exports after a lapse of 15 years. In 2008, Chinese independent brands entered the Russian market and performed well, but with Russia's policy of imposing huge tariffs on Chinese cars, Chinese car companies left Russia on a large scale back then, and the current decline this year is somewhat similar to 2009.
Due to the recent withdrawal of automobile companies from other countries from Russia, Chinese car companies quickly guaranteed Russia's vehicle supply demand in 2023. Earlier, Chinese car companies should be safe in Russia for the time being, but changes in the Russian-Ukrainian crisis brought huge uncertainty to Chinese car companies.
Russia's import rules are continuously adjusted according to supply and demand. In 2024, Russian car sales are already at their highest level in recent years, so a decline is inevitable. Since 2024, China's exports of new energy vehicles to Russia have fluctuated sharply. Gasoline vehicles declined sharply from January to April this year. The mixed domestic demand in Russia has already declined, but exports are still good.
III. Export trends of new energy vehicles
1. Characteristics of NEV exports over the years
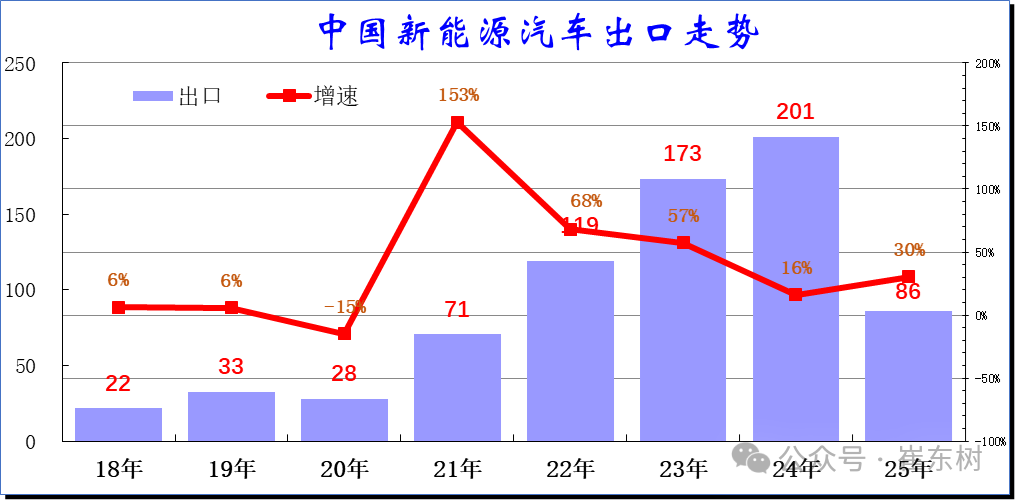
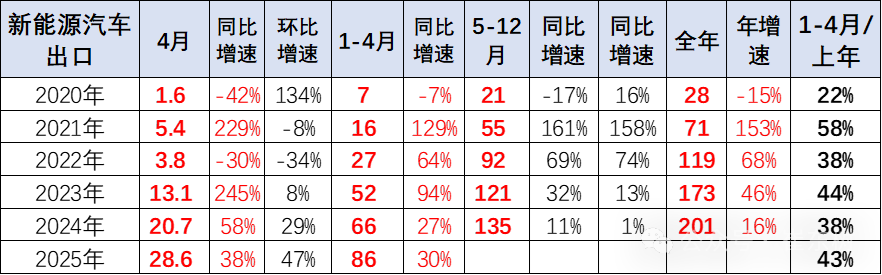
With the transformation of China's domestic NEV market from subsidy-driven to market-driven, China's NEV market competitiveness has increased dramatically. China's NEV exports have exploded since 2021, then entered a continuous high growth range. Despite being disrupted by the EU's NEV export policy in 2024, China's NEV exports still reached 201 million units in 2024, an increase of 16% over the previous year. From January to April 2025, 860,000 new energy vehicles were exported, an increase of 30%, which is a good performance.
The cumulative export volume of new energy vehicles in 2024 was 201 million units, an increase of 16% over the previous year.
The performance of China's NEV exports of 286,000 vehicles increased by 38% in April 2025 is also very good; from January to April 2025, the NEV export volume was 860,000 units, up 30% from the previous year, and the growth rate was higher than the 27% growth rate in January-April 2024.
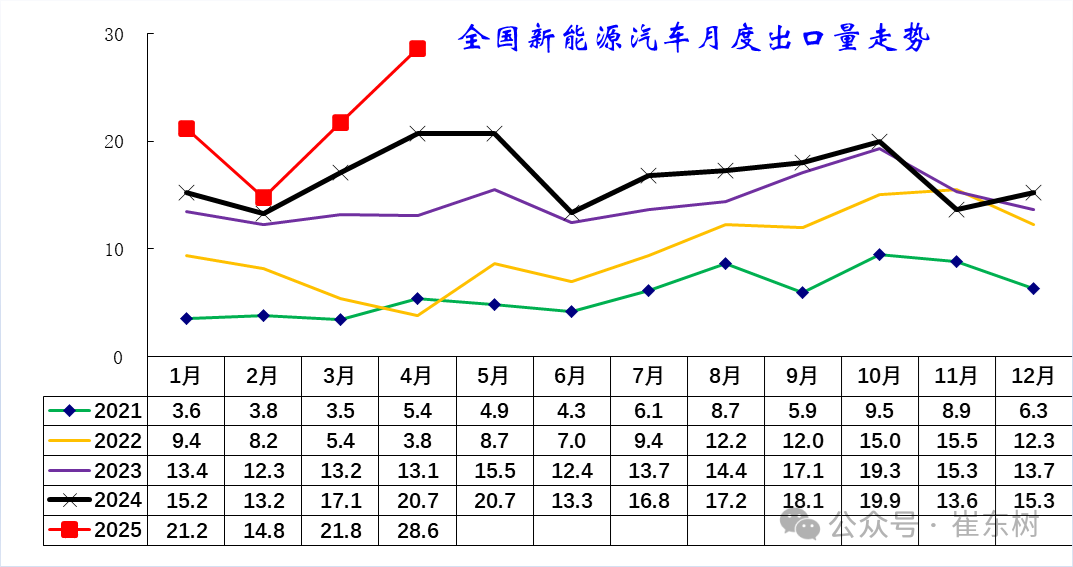
Since June 2024, the trend of new energy exports has been sluggish, and market pressure has been strong. There was an abnormally negative growth situation in November. The trend of a sharp increase in NEV exports in January of this year was strong. In March-April, NEV exports reached a record high, laying the foundation for a good start in 2025.
2. Characteristics of the export structure of new energy vehicles

Before 2019, exports of new energy vehicles were large, but passenger cars were mainly micro low-speed electric vehicles, and the actual number of mainstream new energy models was small. Recently, there has been an improvement in the export structure and quantity performance of new energy passenger vehicles.
In 2025, 70% pure electric vehicles are electric vehicle products from mainstream manufacturers. There is also a good market for low-speed mini electric vehicles.
From January to April 2025, 860,000 new energy vehicles were exported, an increase of 30% over the previous year; of these, NEV passenger vehicle exports accounted for 96% of total NEV exports, and commercial vehicle exports accounted for 4%. Recently, exports of new energy buses and special vehicles have recovered slightly, but due to weak demand for products, there is little potential for short-term overseas demand.
3. Analysis of regional changes in new energy exports

As Tesla entered China, China's automobile export pattern changed. Shanghai has been number one for a long time. April 2025 fluctuated greatly. Recently, Shanghai exports fluctuated sharply, and April was better.
Regions with strong NEV exports in 2025 include Shaanxi, Jiangsu, Shanghai, Guangdong, and Zhejiang.
Judging from the current increase in exports, the increase in Shaanxi, Guangdong, and Anhui in 2025 is relatively large.
4. National characteristics of NEV passenger vehicle exports over the years

In 2025, the year-on-year growth of NEV exports diverged. Exports of new energy vehicles are mainly the two major markets of America and Europe. There is also good low-end demand in the Asian market.
The increase in the Mexican and Australian markets was good this year, but the unit price was not very high. The performance of the Israeli market improved dramatically, and both volume and average price were good. The trend of new energy vehicles in the Indonesian market is also strong, forming a new energy growth point in Southeast Asia.
5. Analysis of changes in NEV exports in 2025

Top 10 countries with total NEV exports in April 2025: Brazil 34,802, Belgium 24,713, Mexico 2,1513, UK 18,529, Philippines 18,407, Australia 16,464, Thailand, 10688, Turkey, 10688, Indonesia, 8754, Spain; the top five countries where China's NEV exports increased in April 2025 compared to April 2024: Mexico 14,135, the Philippines 11070, Turkey 9072, and Indonesia 6710, Australia 4105.
Top 10 countries with total NEV exports from January to April 2025: Belgium 89,273, Mexico 70,275, Brazil 70035, Philippines 51,778, UK 51269, Thailand 43776, Turkey 42919, Australia 42387, UAE 29245, India 2,7043; top five countries where China's NEV exports increased from January to April 2025 compared to January to April 2024: Mexico 49,586, Turkey 35079, Israel 14,643 , Indonesia: 14,232; Philippines: 13,664.
In 2025, exports to Southeast Asia such as Belgium, Mexico, Brazil, and Thailand are some of the main directions. Recently, exports to markets such as Brazil, Russia, and Canada have been weak. Markets such as Mexico and the Philippines performed well.
6. Analysis of changes in motor vehicle exports in 2025

From January to April 2025, China's exports of new energy plug-in hybrid models were 246,000, an increase of 166%, of which the export of plug-in hybrid models increased by 143% in April by 83,000. Apart from the former Soviet Union, Japan, South Korea, the US, Canada and other regions, where demand for mixed mixing declined rapidly, China's mixed performance in other regions was outstanding. Meanwhile, demand for hybrid models from China in the EU has increased, and plug-in hybrid exports from Central and South America have become a new highlight of growth.

In 2024, China exported 3.48 million gasoline models, an increase of 22%; from January to April 2025, China's exports of 950,000 gasoline-fueled vehicles fell 1%. Russia's fuel vehicle market has declined dramatically this year. Other markets are generally good. In particular, the Middle East, Southeast Asia, Africa and other markets are exporting a lot of fuel vehicles, and the characteristics of joint venture exports and resale are obvious.

The strong increase in hybrid models in the Middle East and Europe this year reflects the overall increase in the competitiveness of passenger cars in China.
7. 2025 pure electric vehicle export change analysis year

In 2024, China exported 1.7 million pure electric models, an increase of 6%; from January to April 2025, China's exports of 617,000 pure electric vehicles increased 8%, slightly slower than the export growth rate in 2024.
Currently, the EU market for pure electricity is still the absolute main market, and demand in markets such as Southeast Asia and the Middle East fluctuates relatively greatly. In particular, as the development of new energy sources is slowing down, and China's pure electric power is too pursuing high-end, large-scale problems are serious, small electric vehicles lack good products, and the export pressure for pure electric vehicles is high.
IV. Export trends by passenger car category
1. Export of passenger cars by emission

Passenger car exports are mainly in the 1-1.5 liter range. This is also a comprehensive advantage of China's autonomous passenger car products, but 1.5-liter models declined sharply in 2025. Exports of 1.5-2 liter models grew rapidly in the early stages, indicating that Russia and others are more in demand for high-end, high-priced SUV models from China, but after the Russian market was saturated, the pressure on the high-end was even greater.
However, with the product grade differentiation of electric vehicle models, exports of high-end electric vehicles improved greatly, while entry-level plug-in hybrid exports grew better.
2. Structural characteristics of passenger vehicle exports

China's largest fuel passenger car exports from January to April 2025 include Russia, Mexico, the United Arab Emirates, Saudi Arabia, Kazakhstan, and Australia. The increase in fuel passenger cars this year was mainly in the Middle East and Australia.

China's exports of pure electric passenger vehicles increased mainly from January to April 2025 to Turkey, Mexico, Indonesia, etc.; declining markets include Belgium, Brazil, Canada, and the United Kingdom.

In April 2025, exports of hybrid passenger cars were mainly 2,2773 to Brazil, 11035 to Mexico, 6,405 to the United Kingdom, 4766 from Belgium, 3634 from Israel, 2665 from the United Arab Emirates, 2235 from Spain, 2166 from the Philippines, 2,141 from Italy, and 2082 from Russia. Among them, the top five that increased over the same period were: Mexico 7445, the United Kingdom 5680, Israel 3,634, Belgium 3,516, Brazil 2,910.
From January to April 2025, exports of hybrid passenger cars were mainly 47,181 vehicles from Brazil, 3,4057 vehicles from Belgium, 16,748 vehicles from Israel, 16,321 vehicles from the United Kingdom, 10,693 vehicles from Turkey, 10,375 vehicles from Spain, 7583 vehicles from the United Arab Emirates, 6290 vehicles from Australia, and 6138 vehicles from the Philippines. Among them, the top five that increased this year over the same period last year were: Mexico 23,437, Belgium 2,880, Israel 16,745, the United Kingdom, and 9631 Turkey.

In April 2025, the exports of ordinary hybrids were mainly 6,348 in the UAE, 3,344 in the UK, 1993 in Spain, 1922 in Brazil, 1806 in Mexico, 1,431 in Italy, 971 in France, 866 in Jordan, 820 in the US, and 803 in Australia. Among them, the top five that increased in growth over the same period were: the UAE 2479, Mexico 1256, Brazil 1218, Italy, and 744 Jordanian.
From January to April 2025, exports of ordinary hybrids were mainly 26,104 in the UAE, 1,1953 in the UK, 11039 in Italy, 9432 in Spain, 5426 in Brazil, 5421 in Mexico, 4904 in the US, 4131 in Australia, 4022 in France, and 2,597 in Jordan. Among them, the top five that increased this year over the same period last year were: 17222 in the UAE, 10,458 in Italy, 6632 in Spain, 2,467 in Brazil and 2,422 in Israel.
5. Export trends by truck category
1. Truck exports

Export growth in the truck market has not been strong in recent years. The share of the automobile export market continued to shrink slightly, but the performance was strong in 2025.
The main force in the truck market is gasoline and diesel trucks under 5 tons, and there is also strong demand for heavy diesel trucks of 20 tons or more in general.
2. Characteristics of changes in the truck export market

The overall performance of the top few truck export markets was stable. In April 2025, the main export markets were Mexico 6,692, Vietnam, 5957, Saudi Arabia, 3,621, Chile, 2,485, Philippines, 2167 Ecuador, 2,113 Nigeria, 1,750 Ghana, 1,712 Australia, and 1,708 Peru. Among them, the top five with increased growth over the same period were: Vietnam 2,344, Chile 1,832, Argentina 1,381, Ecuador, and 1,135 Pakistan.

From January to April 2025, the top players in the NEV pure electric truck export market, such as Thailand, the United Kingdom, and the United Arab Emirates, had strong overall performance. Emerging markets fluctuated greatly, and NEV truck exports from many countries skyrocketed and plummeted.

The mixed truck export market has recently surged. Currently, the top players such as Australia and Mexico are showing strong overall performance, and exports of new energy trucks to leading export markets have skyrocketed.
6. Export trends by passenger car category
1. Overall bus exports

Recently, world demand for buses has declined to a certain extent, causing China's bus exports to continue to shrink in the previous two years, from 64,000 vehicles in 2019 to 48,000 units in 2022.
World demand has recovered since 2023, with China reaching 82,000 buses for the full year of 2024, an increase of 16%.
The performance of pure electric bus exports increased by 22% from January to April 2025. Gasoline bus exports increased significantly, but diesel bus exports shrank.
2. Characteristics of changes in the bus export market

The main market for China's bus exports is scattered, mainly from underdeveloped countries. The market is complex, making it difficult to continue exporting in an orderly manner.
Countries in the Middle East, Vietnam, South America, and Southeast Asia are in high demand this year. Among them, Saudi Arabia, Peru, Vietnam and other countries have strong demand for buses. The increase in exports this year was due to markets such as Saudi Arabia, Egypt, and Vietnam. Developing countries are also shrinking, and markets such as Mongolia and Kuwait have declined significantly.

The export market for new energy buses is small, and the data fluctuates greatly. The trend of buses in markets such as Nepal and Israel is strong this year. The performance of developed regions such as Greece, Japan, and Denmark is poor, and overseas demand for electrification of Chinese buses is not very high.