
- LIVE QUOTES
- LEARN
- HELP
 Wall Street Journal
EN
3 European Dividend Stocks To Watch With Up To 4.3% Yield
The European stock markets have shown positive momentum, with the pan-European STOXX Europe 600 Index rising by 2.10% as trade tensions between the U.S. and China eased, boosting investor sentiment across major indices like Germany's DAX and France's CAC 40. In this context of renewed optimism, dividend stocks can offer investors a combination of income generation and potential capital appreciation, making them an attractive option for those looking to navigate current market conditions while benefiting from steady cash flows.
Top 10 Dividend Stocks In Europe
| Name | Dividend Yield | Dividend Rating |
| Bredband2 i Skandinavien (OM:BRE2) | 4.36% | ★★★★★★ |
| Julius Bär Gruppe (SWX:BAER) | 4.77% | ★★★★★★ |
| Zurich Insurance Group (SWX:ZURN) | 4.37% | ★★★★★★ |
| Allianz (XTRA:ALV) | 4.38% | ★★★★★★ |
| Rubis (ENXTPA:RUI) | 6.90% | ★★★★★★ |
| S.N. Nuclearelectrica (BVB:SNN) | 9.19% | ★★★★★★ |
| ERG (BIT:ERG) | 5.75% | ★★★★★★ |
| HEXPOL (OM:HPOL B) | 4.69% | ★★★★★★ |
| OVB Holding (XTRA:O4B) | 4.46% | ★★★★★★ |
| Banque Cantonale Vaudoise (SWX:BCVN) | 4.50% | ★★★★★★ |
Click here to see the full list of 233 stocks from our Top European Dividend Stocks screener.
Let's uncover some gems from our specialized screener.
Transilvania Investments Alliance (BVB:TRANSI)
Simply Wall St Dividend Rating: ★★★★☆☆
Overview: Transilvania Investments Alliance S.A. is a closed-ended financial investment company with a market cap of RON736.76 million.
Operations: Transilvania Investments Alliance S.A. generates its revenue through various financial investment activities, with total revenue reported in millions of RON.
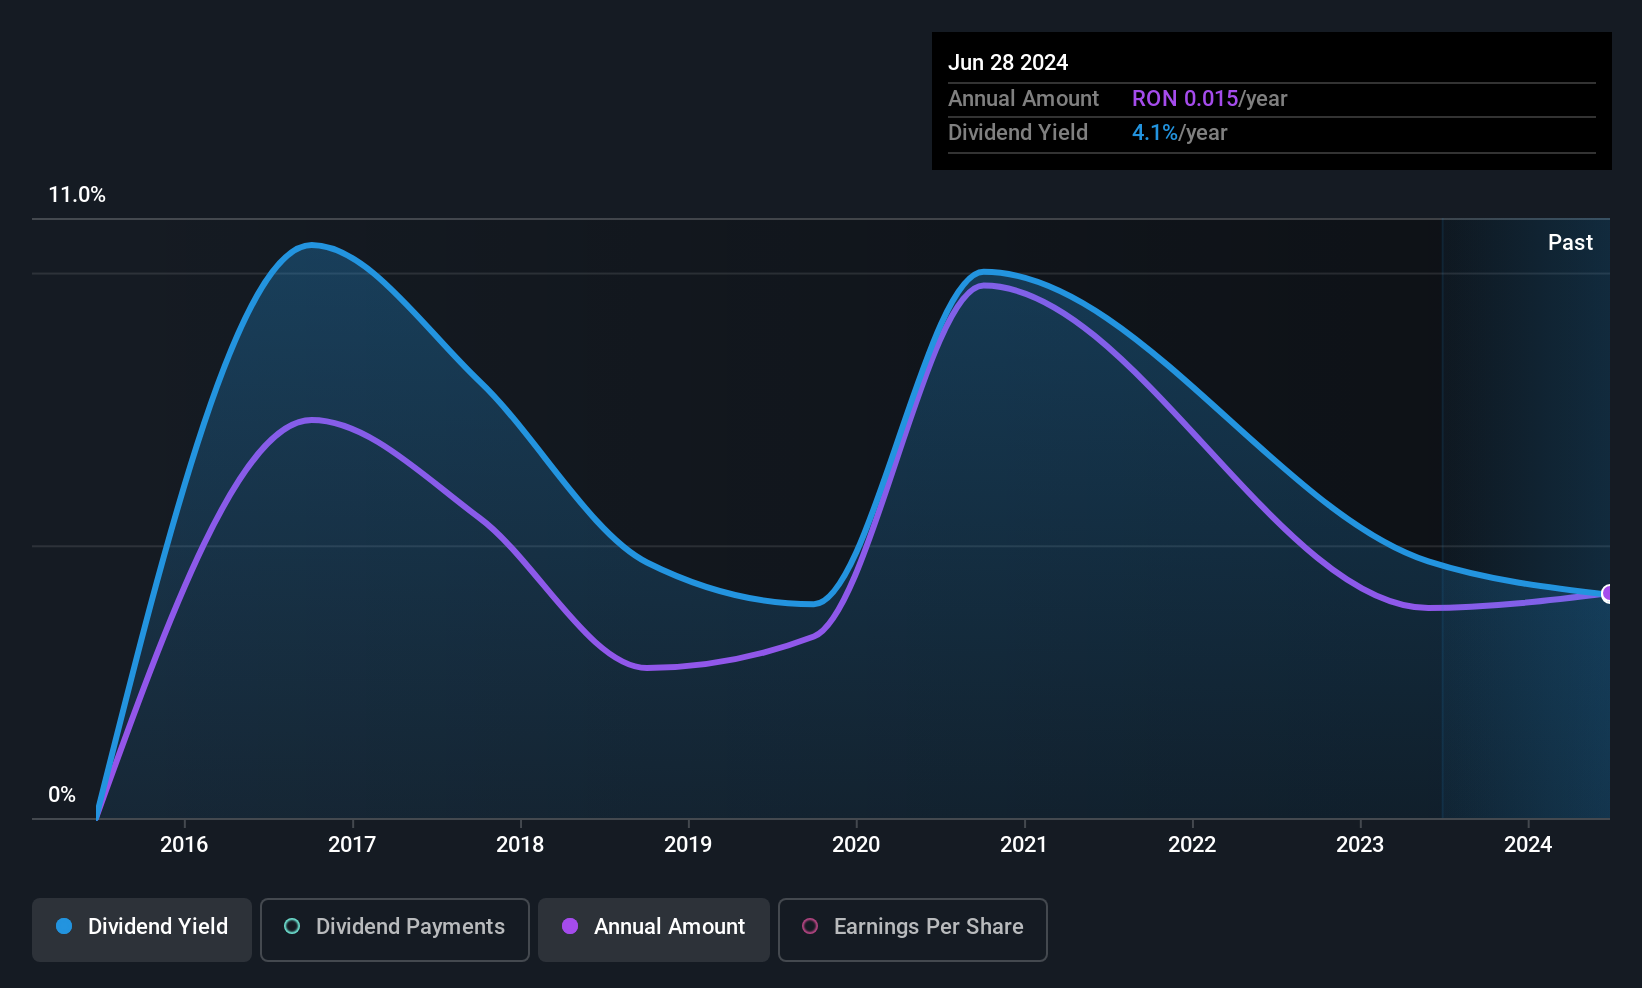
Dividend Yield: 4.3%
Transilvania Investments Alliance offers a mixed dividend profile. With a payout ratio of 45.4% and a cash payout ratio of 66.8%, dividends are well-covered by earnings and cash flows, respectively. However, the dividend yield of 4.32% is below the top tier in the Romanian market, and past payments have been volatile and unreliable despite recent growth over ten years. Recent Q1 earnings showed significant revenue growth to RON 46.77 million from RON 24.39 million year-on-year, potentially supporting future payouts.
- Get an in-depth perspective on Transilvania Investments Alliance's performance by reading our dividend report here.
- Our valuation report unveils the possibility Transilvania Investments Alliance's shares may be trading at a premium.
What's Cooking Group (ENXTBR:WHATS)
Simply Wall St Dividend Rating: ★★★★☆☆
Overview: What's Cooking Group NV, along with its subsidiaries, is engaged in the production and sale of meat products and ready meals, with a market cap of €221.81 million.
Operations: The company's revenue from ready meals amounts to €403.55 million.
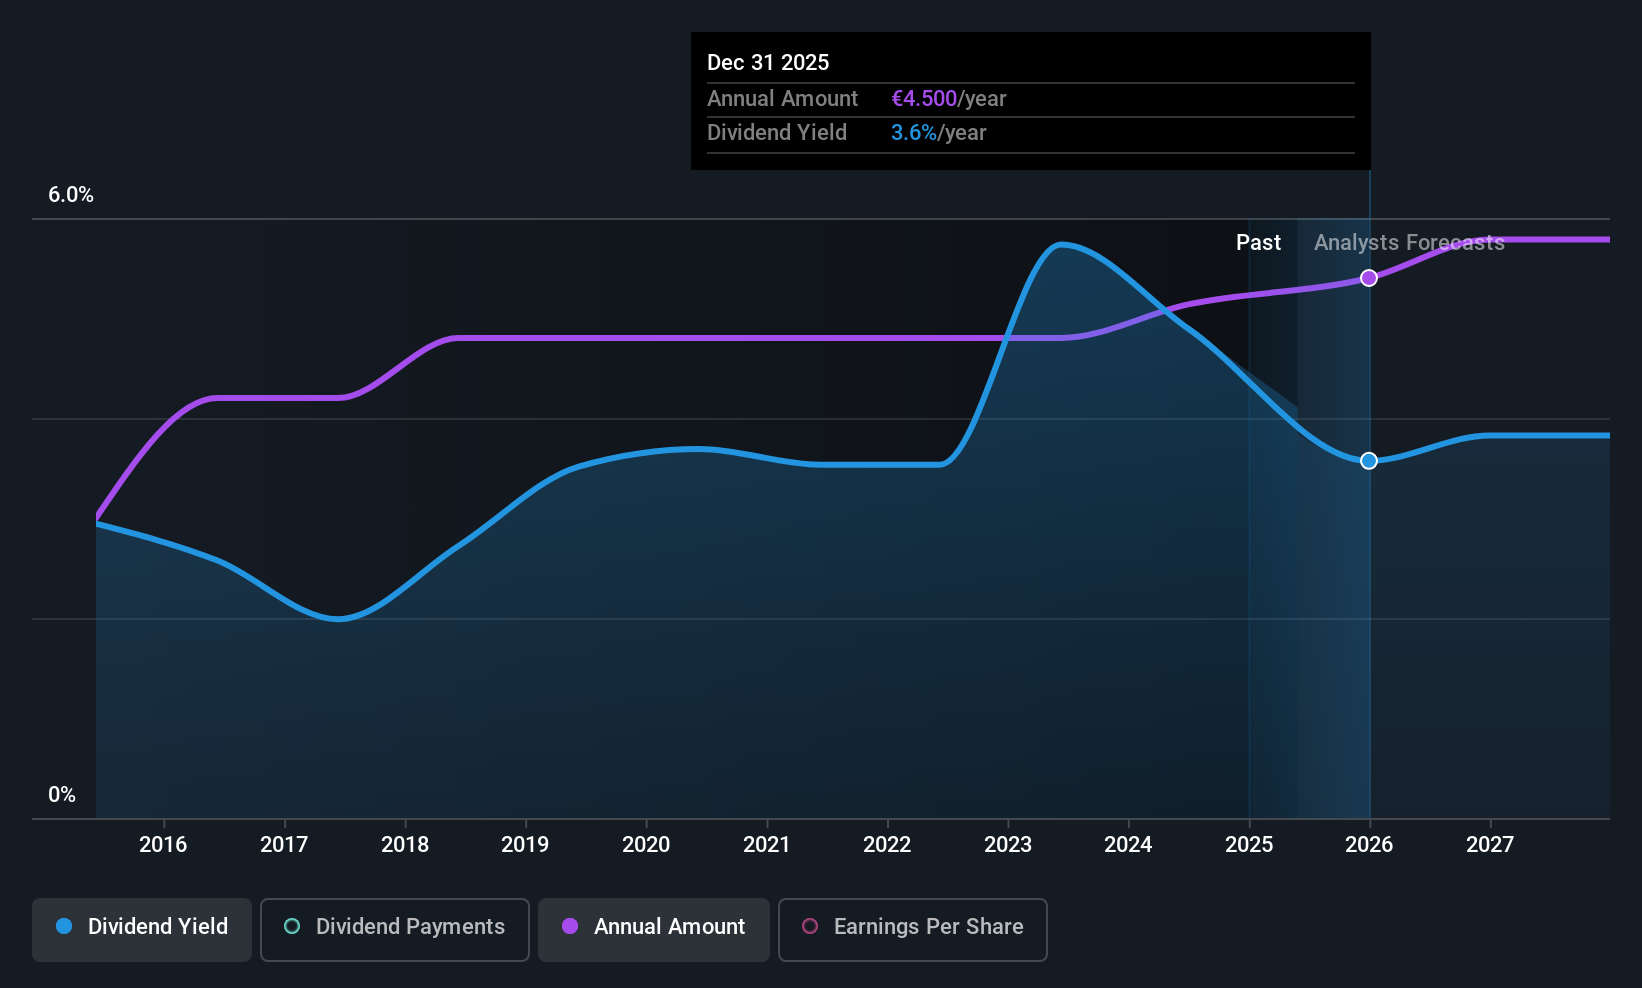
Dividend Yield: 3.8%
What's Cooking Group's dividend yield of 3.77% is lower than the Belgian market's top tier. Despite a high payout ratio of 90.1%, dividends are well-covered by cash flows with a low cash payout ratio of 24.5%. The company has maintained stable and growing dividends over the past decade, showing reliability despite earnings not fully covering payouts. Recent financials reveal strong growth, with net income rising to €20.65 million from €7.66 million year-on-year, potentially supporting future stability in dividends.
- Click to explore a detailed breakdown of our findings in What's Cooking Group's dividend report.
- Insights from our recent valuation report point to the potential undervaluation of What's Cooking Group shares in the market.
Eolus Vind (OM:EOLU B)
Simply Wall St Dividend Rating: ★★★★☆☆
Overview: Eolus Vind AB (publ) focuses on the development, construction, and operation of renewable energy assets across multiple countries including Sweden, Norway, Finland, the United States, Poland, Spain, and the Baltic states with a market cap of SEK1.28 billion.
Operations: Eolus Vind AB (publ) generates revenue through its activities in renewable energy asset development, construction, and operation across various international markets.
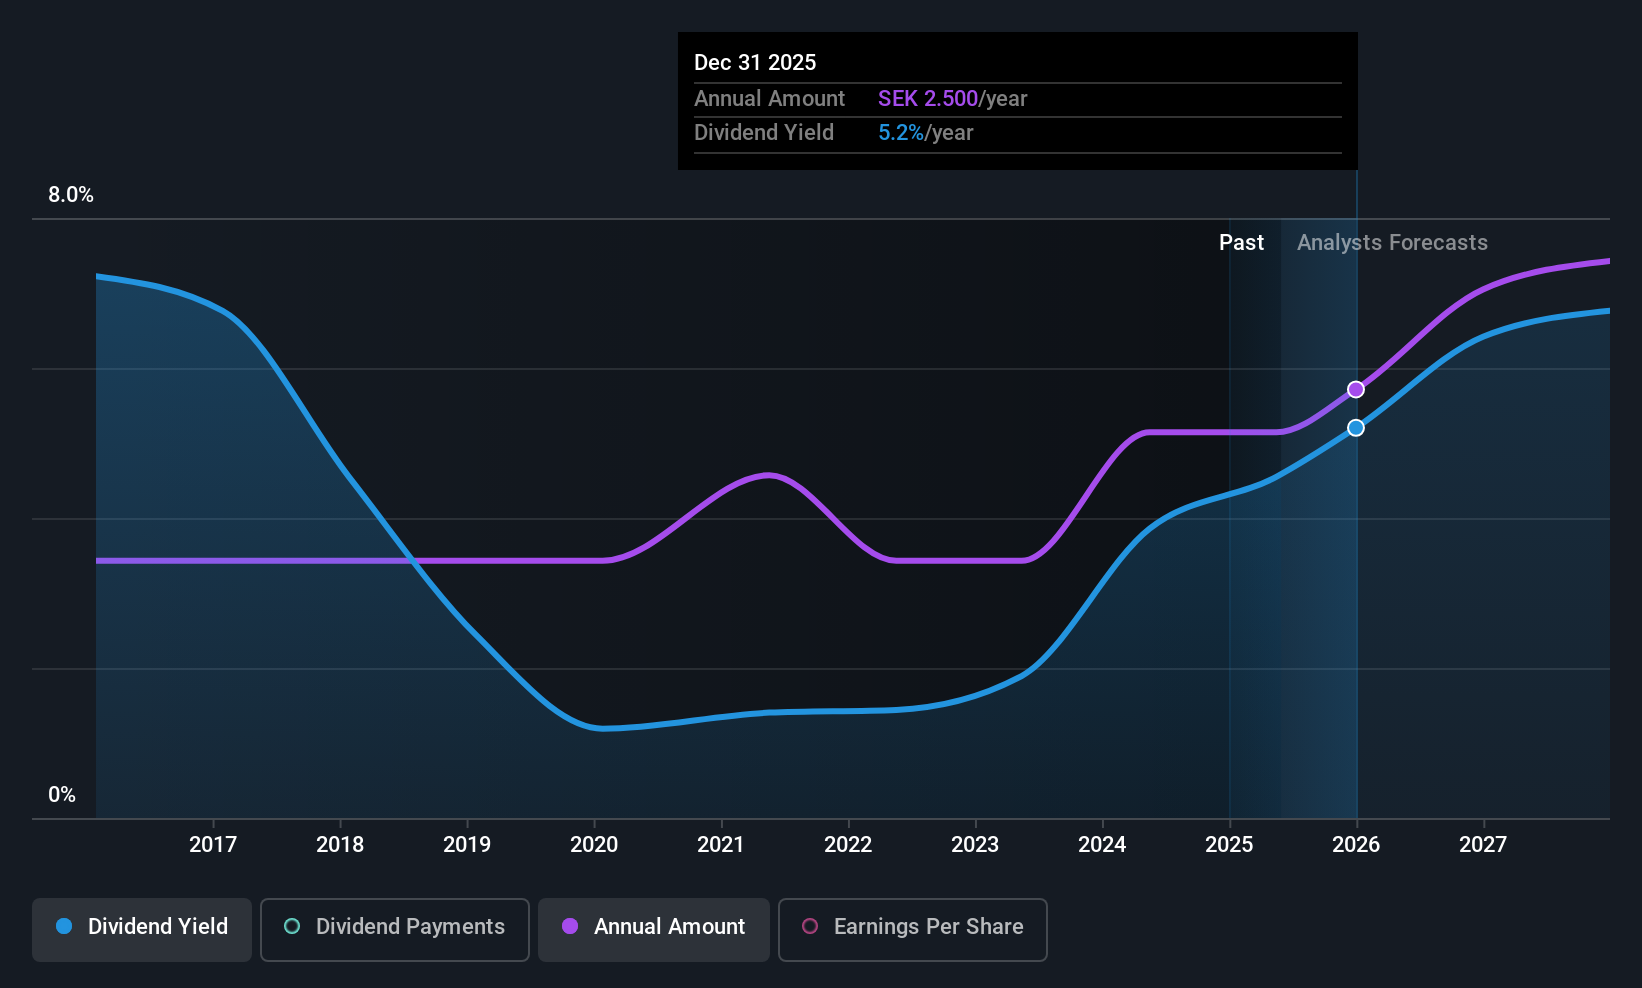
Dividend Yield: 4.4%
Eolus Vind's dividend yield of 4.38% is among the top in Sweden, yet it's not covered by free cash flows, indicating potential sustainability concerns. While dividends have grown over the past decade, they remain volatile and unreliable. Recent financials show improved performance with Q1 sales at SEK 1.98 billion and net income of SEK 90 million, but future earnings are expected to decline slightly. The company trades significantly below its estimated fair value, offering relative market value appeal.
- Take a closer look at Eolus Vind's potential here in our dividend report.
- The valuation report we've compiled suggests that Eolus Vind's current price could be quite moderate.
Taking Advantage
- Delve into our full catalog of 233 Top European Dividend Stocks here.
- Already own these companies? Link your portfolio to Simply Wall St and get alerts on any new warning signs to your stocks.
- Simply Wall St is your key to unlocking global market trends, a free user-friendly app for forward-thinking investors.
Ready For A Different Approach?
- Explore high-performing small cap companies that haven't yet garnered significant analyst attention.
- Fuel your portfolio with companies showing strong growth potential, backed by optimistic outlooks both from analysts and management.
- Find companies with promising cash flow potential yet trading below their fair value.
This article by Simply Wall St is general in nature. We provide commentary based on historical data and analyst forecasts only using an unbiased methodology and our articles are not intended to be financial advice. It does not constitute a recommendation to buy or sell any stock, and does not take account of your objectives, or your financial situation. We aim to bring you long-term focused analysis driven by fundamental data. Note that our analysis may not factor in the latest price-sensitive company announcements or qualitative material. Simply Wall St has no position in any stocks mentioned.
Have feedback on this article? Concerned about the content? Get in touch with us directly. Alternatively, email editorial-team@simplywallst.com