
- LIVE QUOTES
- LEARN
- HELP
 Wall Street Journal
EN
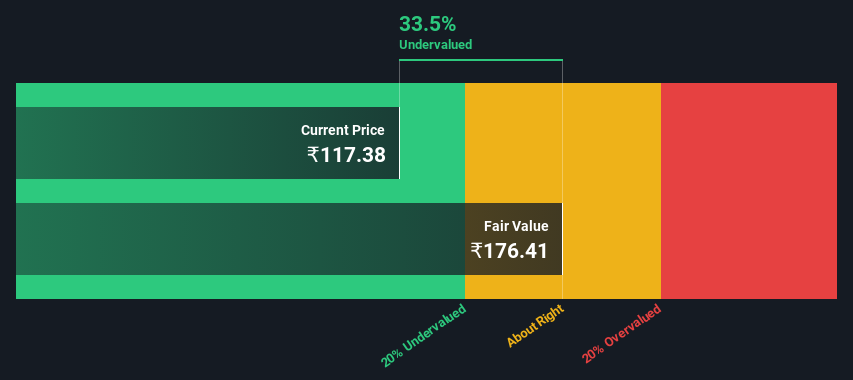
GMR Power And Urban Infra Limited (NSE:GMRP&UI) Shares Could Be 33% Below Their Intrinsic Value Estimate
Key Insights
- Using the 2 Stage Free Cash Flow to Equity, GMR Power And Urban Infra fair value estimate is ₹176
- GMR Power And Urban Infra is estimated to be 33% undervalued based on current share price of ₹117
- Peers of GMR Power And Urban Infra are currently trading on average at a 733% premium
Today we'll do a simple run through of a valuation method used to estimate the attractiveness of GMR Power And Urban Infra Limited (NSE:GMRP&UI) as an investment opportunity by taking the forecast future cash flows of the company and discounting them back to today's value. One way to achieve this is by employing the Discounted Cash Flow (DCF) model. Before you think you won't be able to understand it, just read on! It's actually much less complex than you'd imagine.
Remember though, that there are many ways to estimate a company's value, and a DCF is just one method. For those who are keen learners of equity analysis, the Simply Wall St analysis model here may be something of interest to you.
We've discovered 5 warning signs about GMR Power And Urban Infra. View them for free.Step By Step Through The Calculation
We use what is known as a 2-stage model, which simply means we have two different periods of growth rates for the company's cash flows. Generally the first stage is higher growth, and the second stage is a lower growth phase. To start off with, we need to estimate the next ten years of cash flows. Where possible we use analyst estimates, but when these aren't available we extrapolate the previous free cash flow (FCF) from the last estimate or reported value. We assume companies with shrinking free cash flow will slow their rate of shrinkage, and that companies with growing free cash flow will see their growth rate slow, over this period. We do this to reflect that growth tends to slow more in the early years than it does in later years.
A DCF is all about the idea that a dollar in the future is less valuable than a dollar today, and so the sum of these future cash flows is then discounted to today's value:
10-year free cash flow (FCF) forecast
| 2025 | 2026 | 2027 | 2028 | 2029 | 2030 | 2031 | 2032 | 2033 | 2034 | |
| Levered FCF (₹, Millions) | ₹13.9b | ₹14.3b | ₹16.0b | ₹17.5b | ₹18.9b | ₹20.4b | ₹22.0b | ₹23.6b | ₹25.3b | ₹27.0b |
| Growth Rate Estimate Source | Analyst x2 | Analyst x2 | Analyst x2 | Est @ 9.15% | Est @ 8.42% | Est @ 7.91% | Est @ 7.55% | Est @ 7.30% | Est @ 7.13% | Est @ 7.01% |
| Present Value (₹, Millions) Discounted @ 18% | ₹11.8k | ₹10.2k | ₹9.7k | ₹8.9k | ₹8.2k | ₹7.5k | ₹6.8k | ₹6.1k | ₹5.6k | ₹5.0k |
("Est" = FCF growth rate estimated by Simply Wall St)
Present Value of 10-year Cash Flow (PVCF) = ₹80b
After calculating the present value of future cash flows in the initial 10-year period, we need to calculate the Terminal Value, which accounts for all future cash flows beyond the first stage. The Gordon Growth formula is used to calculate Terminal Value at a future annual growth rate equal to the 5-year average of the 10-year government bond yield of 6.7%. We discount the terminal cash flows to today's value at a cost of equity of 18%.
Terminal Value (TV)= FCF2034 × (1 + g) ÷ (r – g) = ₹27b× (1 + 6.7%) ÷ (18%– 6.7%) = ₹249b
Present Value of Terminal Value (PVTV)= TV / (1 + r)10= ₹249b÷ ( 1 + 18%)10= ₹46b
The total value, or equity value, is then the sum of the present value of the future cash flows, which in this case is ₹126b. The last step is to then divide the equity value by the number of shares outstanding. Compared to the current share price of ₹117, the company appears quite undervalued at a 33% discount to where the stock price trades currently. The assumptions in any calculation have a big impact on the valuation, so it is better to view this as a rough estimate, not precise down to the last cent.
The Assumptions
The calculation above is very dependent on two assumptions. The first is the discount rate and the other is the cash flows. If you don't agree with these result, have a go at the calculation yourself and play with the assumptions. The DCF also does not consider the possible cyclicality of an industry, or a company's future capital requirements, so it does not give a full picture of a company's potential performance. Given that we are looking at GMR Power And Urban Infra as potential shareholders, the cost of equity is used as the discount rate, rather than the cost of capital (or weighted average cost of capital, WACC) which accounts for debt. In this calculation we've used 18%, which is based on a levered beta of 1.596. Beta is a measure of a stock's volatility, compared to the market as a whole. We get our beta from the industry average beta of globally comparable companies, with an imposed limit between 0.8 and 2.0, which is a reasonable range for a stable business.
See our latest analysis for GMR Power And Urban Infra
SWOT Analysis for GMR Power And Urban Infra
- Debt is well covered by cash flow.
- Interest payments on debt are not well covered.
- Shareholders have been diluted in the past year.
- Good value based on P/E ratio and estimated fair value.
- No apparent threats visible for GMRP&UI.
Moving On:
Whilst important, the DCF calculation shouldn't be the only metric you look at when researching a company. The DCF model is not a perfect stock valuation tool. Rather it should be seen as a guide to "what assumptions need to be true for this stock to be under/overvalued?" If a company grows at a different rate, or if its cost of equity or risk free rate changes sharply, the output can look very different. Why is the intrinsic value higher than the current share price? For GMR Power And Urban Infra, we've put together three important factors you should further research:
- Risks: Every company has them, and we've spotted 5 warning signs for GMR Power And Urban Infra (of which 2 are a bit unpleasant!) you should know about.
- Future Earnings: How does GMRP&UI's growth rate compare to its peers and the wider market? Dig deeper into the analyst consensus number for the upcoming years by interacting with our free analyst growth expectation chart.
- Other Solid Businesses: Low debt, high returns on equity and good past performance are fundamental to a strong business. Why not explore our interactive list of stocks with solid business fundamentals to see if there are other companies you may not have considered!
PS. The Simply Wall St app conducts a discounted cash flow valuation for every stock on the NSEI every day. If you want to find the calculation for other stocks just search here.
Have feedback on this article? Concerned about the content? Get in touch with us directly. Alternatively, email editorial-team (at) simplywallst.com.
This article by Simply Wall St is general in nature. We provide commentary based on historical data and analyst forecasts only using an unbiased methodology and our articles are not intended to be financial advice. It does not constitute a recommendation to buy or sell any stock, and does not take account of your objectives, or your financial situation. We aim to bring you long-term focused analysis driven by fundamental data. Note that our analysis may not factor in the latest price-sensitive company announcements or qualitative material. Simply Wall St has no position in any stocks mentioned.