
- LIVE QUOTES
- LEARN
- HELP
 Wall Street Journal
EN
Walmart's Earnings: A Preview
Walmart (NYSE:WMT) is gearing up to announce its quarterly earnings on Thursday, 2025-05-15. Here's a quick overview of what investors should know before the release.
Analysts are estimating that Walmart will report an earnings per share (EPS) of $0.59.
The announcement from Walmart is eagerly anticipated, with investors seeking news of surpassing estimates and favorable guidance for the next quarter.
It's worth noting for new investors that guidance can be a key determinant of stock price movements.
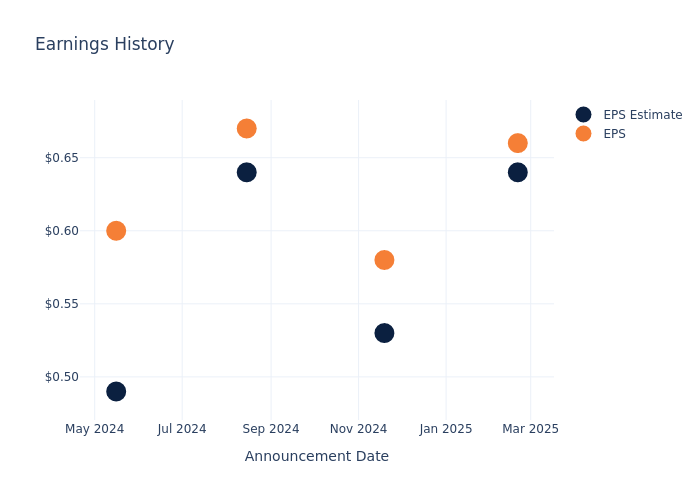
Historical Earnings Performance
Last quarter the company beat EPS by $0.02, which was followed by a 2.5% drop in the share price the next day.
Here's a look at Walmart's past performance and the resulting price change:
| Quarter | Q4 2025 | Q3 2025 | Q2 2025 | Q1 2025 |
|---|---|---|---|---|
| EPS Estimate | 0.64 | 0.53 | 0.64 | 0.49 |
| EPS Actual | 0.66 | 0.58 | 0.67 | 0.60 |
| Price Change % | -2.0% | 1.0% | 1.0% | 1.0% |
Tracking Walmart's Stock Performance
Shares of Walmart were trading at $95.88 as of May 13. Over the last 52-week period, shares are up 50.2%. Given that these returns are generally positive, long-term shareholders are likely bullish going into this earnings release.
Analysts' Perspectives on Walmart
For investors, grasping market sentiments and expectations in the industry is vital. This analysis explores the latest insights regarding Walmart.
Walmart has received a total of 25 ratings from analysts, with the consensus rating as Outperform. With an average one-year price target of $106.68, the consensus suggests a potential 11.26% upside.
Comparing Ratings with Competitors
In this analysis, we delve into the analyst ratings and average 1-year price targets of Costco Wholesale, Target and Dollar General, three key industry players, offering insights into their relative performance expectations and market positioning.
- Analysts currently favor an Outperform trajectory for Costco Wholesale, with an average 1-year price target of $1070.62, suggesting a potential 1016.62% upside.
- Analysts currently favor an Neutral trajectory for Target, with an average 1-year price target of $124.0, suggesting a potential 29.33% upside.
- Analysts currently favor an Neutral trajectory for Dollar General, with an average 1-year price target of $88.4, suggesting a potential 7.8% downside.
Peer Metrics Summary
The peer analysis summary outlines pivotal metrics for Costco Wholesale, Target and Dollar General, demonstrating their respective standings within the industry and offering valuable insights into their market positions and comparative performance.
| Company | Consensus | Revenue Growth | Gross Profit | Return on Equity |
|---|---|---|---|---|
| Walmart | Outperform | 4.13% | $44.38B | 5.87% |
| Costco Wholesale | Outperform | 9.04% | $7.98B | 7.15% |
| Target | Neutral | -3.15% | $8.04B | 7.57% |
| Dollar General | Neutral | 4.52% | $3.03B | 2.59% |
Key Takeaway:
Walmart ranks first in gross profit and return on equity among its peers. It ranks second in revenue growth.
Delving into Walmart's Background
Walmart serves as a leading retailer in the United States, with its strategy predicated on superior operating efficiency and offering the lowest priced goods to consumers to drive robust store traffic and product turnover. Walmart augmented its low-price business strategy by offering a convenient one-stop shopping destination with the opening of its first supercenter in 1988.Today, Walmart operates over 4,600 stores in the United States (5,200 including Sam's Club) and over 10,000 locations globally. Walmart generated over $460 billion in domestic namesake sales in fiscal 2025, with Sam's Club contributing another $90 billion to the company's top line. Internationally, Walmart generated $120 billion in sales. The retailer serves around 270 million customers globally each week.
Key Indicators: Walmart's Financial Health
Market Capitalization Highlights: Above the industry average, the company's market capitalization signifies a significant scale, indicating strong confidence and market prominence.
Positive Revenue Trend: Examining Walmart's financials over 3 months reveals a positive narrative. The company achieved a noteworthy revenue growth rate of 4.13% as of 31 January, 2025, showcasing a substantial increase in top-line earnings. When compared to others in the Consumer Staples sector, the company excelled with a growth rate higher than the average among peers.
Net Margin: Walmart's net margin excels beyond industry benchmarks, reaching 2.91%. This signifies efficient cost management and strong financial health.
Return on Equity (ROE): Walmart's ROE stands out, surpassing industry averages. With an impressive ROE of 5.87%, the company demonstrates effective use of equity capital and strong financial performance.
Return on Assets (ROA): Walmart's ROA surpasses industry standards, highlighting the company's exceptional financial performance. With an impressive 2.0% ROA, the company effectively utilizes its assets for optimal returns.
Debt Management: Walmart's debt-to-equity ratio is below the industry average at 0.66, reflecting a lower dependency on debt financing and a more conservative financial approach.
To track all earnings releases for Walmart visit their earnings calendar on our site.
This article was generated by Benzinga's automated content engine and reviewed by an editor.