
- LIVE QUOTES
- LEARN
- HELP
 Wall Street Journal
EN
TaskUs (NASDAQ:TASK) Has A Pretty Healthy Balance Sheet
The external fund manager backed by Berkshire Hathaway's Charlie Munger, Li Lu, makes no bones about it when he says 'The biggest investment risk is not the volatility of prices, but whether you will suffer a permanent loss of capital.' So it might be obvious that you need to consider debt, when you think about how risky any given stock is, because too much debt can sink a company. We note that TaskUs, Inc. (NASDAQ:TASK) does have debt on its balance sheet. But the more important question is: how much risk is that debt creating?
Why Does Debt Bring Risk?
Debt assists a business until the business has trouble paying it off, either with new capital or with free cash flow. Ultimately, if the company can't fulfill its legal obligations to repay debt, shareholders could walk away with nothing. However, a more frequent (but still costly) occurrence is where a company must issue shares at bargain-basement prices, permanently diluting shareholders, just to shore up its balance sheet. By replacing dilution, though, debt can be an extremely good tool for businesses that need capital to invest in growth at high rates of return. When we think about a company's use of debt, we first look at cash and debt together.
What Is TaskUs's Debt?
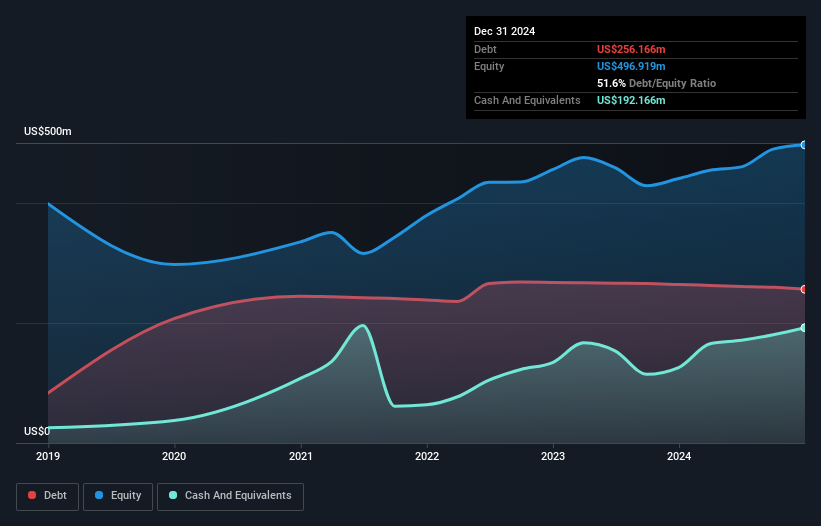
The chart below, which you can click on for greater detail, shows that TaskUs had US$256.2m in debt in December 2024; about the same as the year before. However, because it has a cash reserve of US$192.2m, its net debt is less, at about US$64.0m.
How Strong Is TaskUs' Balance Sheet?
According to the last reported balance sheet, TaskUs had liabilities of US$152.0m due within 12 months, and liabilities of US$304.4m due beyond 12 months. Offsetting this, it had US$192.2m in cash and US$199.9m in receivables that were due within 12 months. So it has liabilities totalling US$64.3m more than its cash and near-term receivables, combined.
Of course, TaskUs has a market capitalization of US$1.24b, so these liabilities are probably manageable. But there are sufficient liabilities that we would certainly recommend shareholders continue to monitor the balance sheet, going forward.
View our latest analysis for TaskUs
We measure a company's debt load relative to its earnings power by looking at its net debt divided by its earnings before interest, tax, depreciation, and amortization (EBITDA) and by calculating how easily its earnings before interest and tax (EBIT) cover its interest expense (interest cover). Thus we consider debt relative to earnings both with and without depreciation and amortization expenses.
While TaskUs's low debt to EBITDA ratio of 0.38 suggests only modest use of debt, the fact that EBIT only covered the interest expense by 6.7 times last year does give us pause. So we'd recommend keeping a close eye on the impact financing costs are having on the business. Fortunately, TaskUs grew its EBIT by 3.2% in the last year, making that debt load look even more manageable. When analysing debt levels, the balance sheet is the obvious place to start. But ultimately the future profitability of the business will decide if TaskUs can strengthen its balance sheet over time. So if you're focused on the future you can check out this free report showing analyst profit forecasts.
But our final consideration is also important, because a company cannot pay debt with paper profits; it needs cold hard cash. So the logical step is to look at the proportion of that EBIT that is matched by actual free cash flow. Over the last three years, TaskUs actually produced more free cash flow than EBIT. There's nothing better than incoming cash when it comes to staying in your lenders' good graces.
Our View
The good news is that TaskUs's demonstrated ability to convert EBIT to free cash flow delights us like a fluffy puppy does a toddler. And that's just the beginning of the good news since its net debt to EBITDA is also very heartening. Zooming out, TaskUs seems to use debt quite reasonably; and that gets the nod from us. After all, sensible leverage can boost returns on equity. Over time, share prices tend to follow earnings per share, so if you're interested in TaskUs, you may well want to click here to check an interactive graph of its earnings per share history.
Of course, if you're the type of investor who prefers buying stocks without the burden of debt, then don't hesitate to discover our exclusive list of net cash growth stocks, today.
Have feedback on this article? Concerned about the content? Get in touch with us directly. Alternatively, email editorial-team (at) simplywallst.com.
This article by Simply Wall St is general in nature. We provide commentary based on historical data and analyst forecasts only using an unbiased methodology and our articles are not intended to be financial advice. It does not constitute a recommendation to buy or sell any stock, and does not take account of your objectives, or your financial situation. We aim to bring you long-term focused analysis driven by fundamental data. Note that our analysis may not factor in the latest price-sensitive company announcements or qualitative material. Simply Wall St has no position in any stocks mentioned.