
- LIVE QUOTES
- LEARN
- HELP
 Wall Street Journal
EN
3 Stocks Estimated To Be Trading At Up To 49.5% Below Intrinsic Value
Over the last 7 days, the United States market has experienced a slight decline of 1.7%, although it remains up by 3.6% over the past year, with earnings projected to grow by 13% annually. In such fluctuating conditions, identifying stocks that are potentially trading below their intrinsic value can present opportunities for investors seeking long-term growth at a discount.
Top 10 Undervalued Stocks Based On Cash Flows In The United States
| Name | Current Price | Fair Value (Est) | Discount (Est) |
| MetroCity Bankshares (NasdaqGS:MCBS) | $28.55 | $56.26 | 49.3% |
| Truist Financial (NYSE:TFC) | $36.34 | $71.55 | 49.2% |
| DoorDash (NasdaqGS:DASH) | $176.61 | $352.46 | 49.9% |
| AGNC Investment (NasdaqGS:AGNC) | $8.45 | $16.73 | 49.5% |
| Flotek Industries (NYSE:FTK) | $6.67 | $13.11 | 49.1% |
| Verra Mobility (NasdaqCM:VRRM) | $21.89 | $43.36 | 49.5% |
| First Advantage (NasdaqGS:FA) | $13.63 | $27.00 | 49.5% |
| Sotera Health (NasdaqGS:SHC) | $10.64 | $20.91 | 49.1% |
| CNX Resources (NYSE:CNX) | $30.29 | $60.47 | 49.9% |
| Comstock Resources (NYSE:CRK) | $18.22 | $35.86 | 49.2% |
Below we spotlight a couple of our favorites from our exclusive screener.
AGNC Investment (NasdaqGS:AGNC)
Overview: AGNC Investment Corp., with a market cap of $7.74 billion, provides private capital to the housing market in the United States.
Operations: AGNC Investment Corp.'s revenue segments are not specified in the provided text.
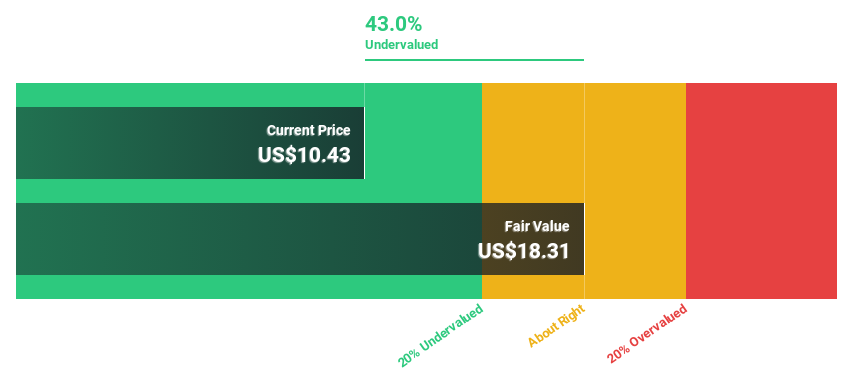
Estimated Discount To Fair Value: 49.5%
AGNC Investment is trading at US$8.45, significantly below its estimated fair value of US$16.73, indicating potential undervaluation based on cash flows. Despite a forecasted earnings growth of 53.6% annually over the next three years, recent earnings showed a sharp decline with net income at US$50 million for Q1 2025 compared to US$443 million a year ago. The dividend yield remains high but isn't well covered by earnings or free cash flow, suggesting sustainability concerns.
- The growth report we've compiled suggests that AGNC Investment's future prospects could be on the up.
- Click to explore a detailed breakdown of our findings in AGNC Investment's balance sheet health report.
Sportradar Group (NasdaqGS:SRAD)
Overview: Sportradar Group AG, along with its subsidiaries, provides sports data services across the United Kingdom, the United States, Malta, Switzerland, and internationally, with a market cap of approximately $6.89 billion.
Operations: The company's revenue primarily comes from its Data Processing segment, which generated €1.11 billion.
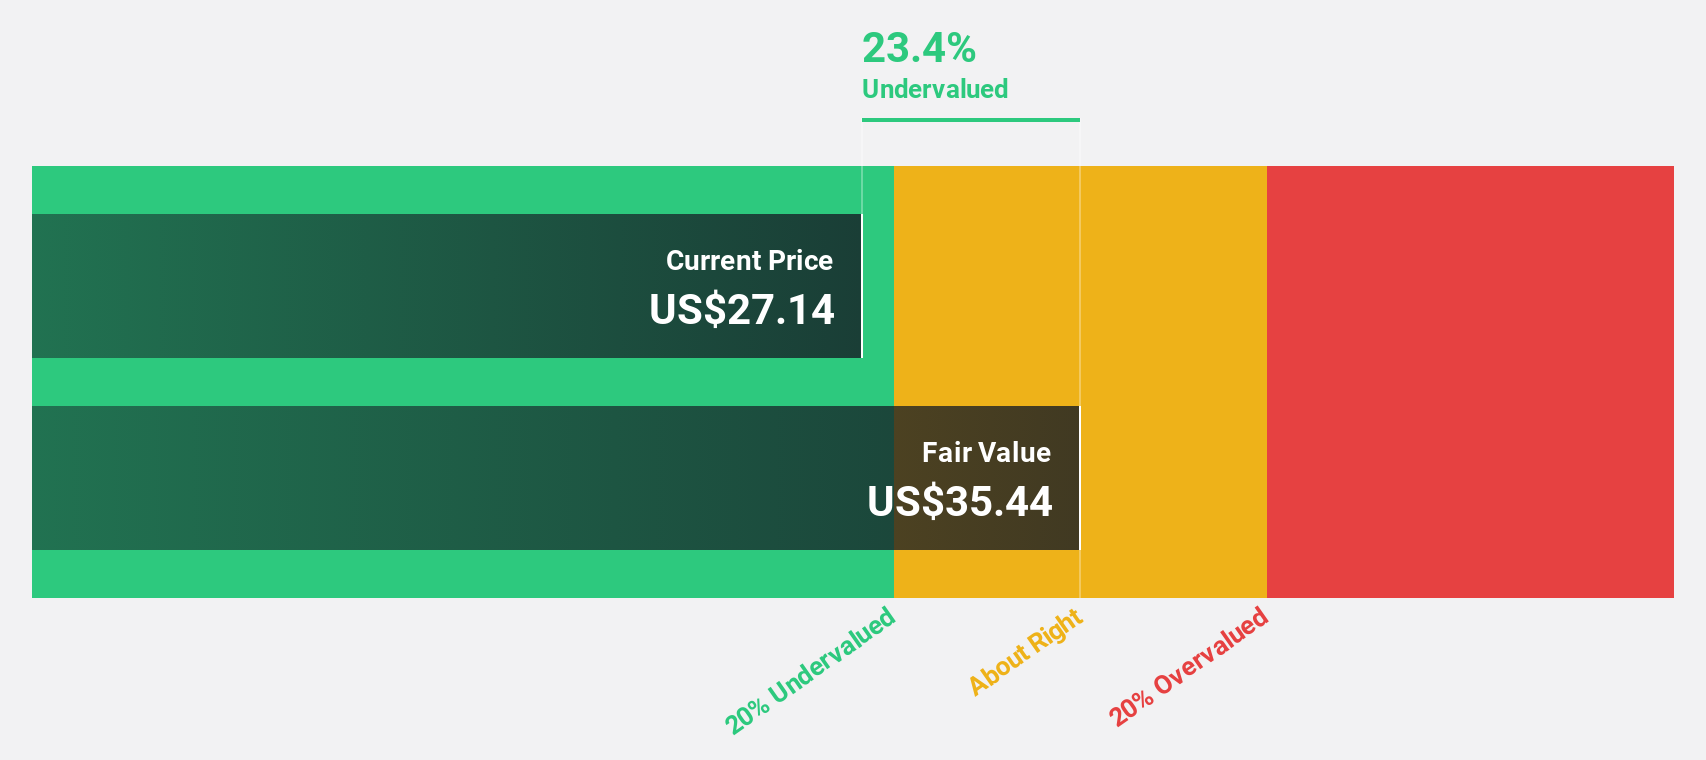
Estimated Discount To Fair Value: 30.3%
Sportradar Group is trading at US$25.04, below its estimated fair value of US$35.91, highlighting potential undervaluation based on cash flows. With an expected annual earnings growth of 34%, surpassing the US market's 13.3%, Sportradar's revenue is forecast to grow faster than the market average. Despite recent net loss for Q4 2024 and a follow-on equity offering, the company maintains a strong balance sheet with over $350 million in cash and no debt.
- Our comprehensive growth report raises the possibility that Sportradar Group is poised for substantial financial growth.
- Unlock comprehensive insights into our analysis of Sportradar Group stock in this financial health report.
Annaly Capital Management (NYSE:NLY)
Overview: Annaly Capital Management, Inc. is a diversified capital manager that operates in the mortgage finance business with a market cap of approximately $10.51 billion.
Operations: Annaly Capital Management's revenue is primarily derived from its Agency segment ($353.81 million), Residential Credit ($419.75 million), and Mortgage Servicing Rights (MSR) ($466.08 million).
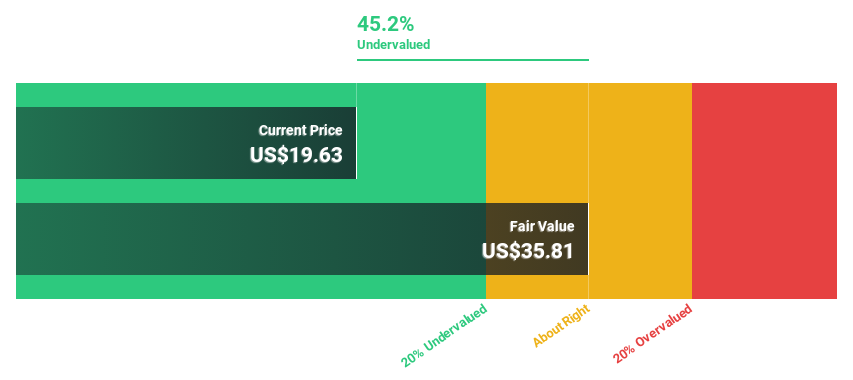
Estimated Discount To Fair Value: 38.2%
Annaly Capital Management is trading at US$18.34, significantly below its estimated fair value of US$29.70, suggesting undervaluation based on cash flows. Earnings are forecast to grow 26.9% annually, outpacing the broader US market's growth rate of 13.3%. Despite past shareholder dilution and a dividend not fully covered by earnings, Annaly reported strong net income for the full year 2024 at US$1 billion compared to a loss in the previous year.
- According our earnings growth report, there's an indication that Annaly Capital Management might be ready to expand.
- Delve into the full analysis health report here for a deeper understanding of Annaly Capital Management.
Next Steps
- Click this link to deep-dive into the 176 companies within our Undervalued US Stocks Based On Cash Flows screener.
- Have you diversified into these companies? Leverage the power of Simply Wall St's portfolio to keep a close eye on market movements affecting your investments.
- Simply Wall St is a revolutionary app designed for long-term stock investors, it's free and covers every market in the world.
Looking For Alternative Opportunities?
- Explore high-performing small cap companies that haven't yet garnered significant analyst attention.
- Diversify your portfolio with solid dividend payers offering reliable income streams to weather potential market turbulence.
- Fuel your portfolio with companies showing strong growth potential, backed by optimistic outlooks both from analysts and management.
This article by Simply Wall St is general in nature. We provide commentary based on historical data and analyst forecasts only using an unbiased methodology and our articles are not intended to be financial advice. It does not constitute a recommendation to buy or sell any stock, and does not take account of your objectives, or your financial situation. We aim to bring you long-term focused analysis driven by fundamental data. Note that our analysis may not factor in the latest price-sensitive company announcements or qualitative material. Simply Wall St has no position in any stocks mentioned.
Have feedback on this article? Concerned about the content? Get in touch with us directly. Alternatively, email editorial-team@simplywallst.com