
- LIVE QUOTES
- LEARN
- HELP
 Wall Street Journal
EN
Recent uptick might appease Aspen Pharmacare Holdings Limited (JSE:APN) institutional owners after losing 23% over the past year
Key Insights
- Significantly high institutional ownership implies Aspen Pharmacare Holdings' stock price is sensitive to their trading actions
- A total of 6 investors have a majority stake in the company with 52% ownership
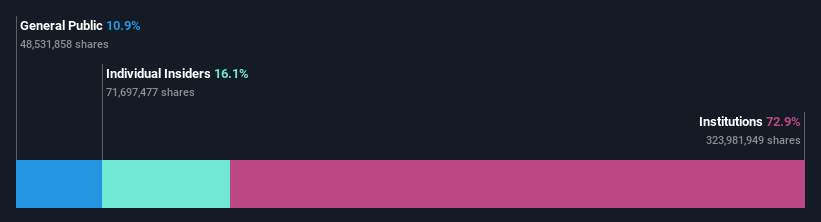
- Insiders own 16% of Aspen Pharmacare Holdings
To get a sense of who is truly in control of Aspen Pharmacare Holdings Limited (JSE:APN), it is important to understand the ownership structure of the business. We can see that institutions own the lion's share in the company with 73% ownership. Put another way, the group faces the maximum upside potential (or downside risk).
Institutional investors would probably welcome last week's 4.0% increase in the share price after a year of 23% losses as a sign that returns may to begin trending higher.
Let's delve deeper into each type of owner of Aspen Pharmacare Holdings, beginning with the chart below.
View our latest analysis for Aspen Pharmacare Holdings
What Does The Institutional Ownership Tell Us About Aspen Pharmacare Holdings?
Many institutions measure their performance against an index that approximates the local market. So they usually pay more attention to companies that are included in major indices.
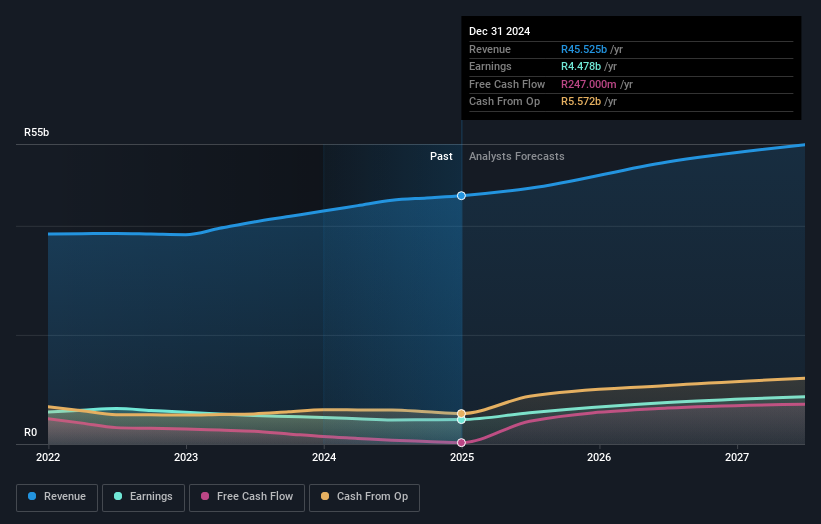
Aspen Pharmacare Holdings already has institutions on the share registry. Indeed, they own a respectable stake in the company. This suggests some credibility amongst professional investors. But we can't rely on that fact alone since institutions make bad investments sometimes, just like everyone does. When multiple institutions own a stock, there's always a risk that they are in a 'crowded trade'. When such a trade goes wrong, multiple parties may compete to sell stock fast. This risk is higher in a company without a history of growth. You can see Aspen Pharmacare Holdings' historic earnings and revenue below, but keep in mind there's always more to the story.
Institutional investors own over 50% of the company, so together than can probably strongly influence board decisions. We note that hedge funds don't have a meaningful investment in Aspen Pharmacare Holdings. The company's largest shareholder is Public Investment Corporation Limited, with ownership of 19%. With 12% and 8.0% of the shares outstanding respectively, Stephen Saad and Coronation Fund Managers Limited are the second and third largest shareholders. Stephen Saad, who is the second-largest shareholder, also happens to hold the title of Chief Executive Officer.
We did some more digging and found that 6 of the top shareholders account for roughly 52% of the register, implying that along with larger shareholders, there are a few smaller shareholders, thereby balancing out each others interests somewhat.
While it makes sense to study institutional ownership data for a company, it also makes sense to study analyst sentiments to know which way the wind is blowing. There are a reasonable number of analysts covering the stock, so it might be useful to find out their aggregate view on the future.
Insider Ownership Of Aspen Pharmacare Holdings
While the precise definition of an insider can be subjective, almost everyone considers board members to be insiders. The company management answer to the board and the latter should represent the interests of shareholders. Notably, sometimes top-level managers are on the board themselves.
I generally consider insider ownership to be a good thing. However, on some occasions it makes it more difficult for other shareholders to hold the board accountable for decisions.
Our most recent data indicates that insiders own a reasonable proportion of Aspen Pharmacare Holdings Limited. It has a market capitalization of just R73b, and insiders have R12b worth of shares in their own names. That's quite significant. Most would say this shows a good degree of alignment with shareholders, especially in a company of this size. You can click here to see if those insiders have been buying or selling.
General Public Ownership
The general public-- including retail investors -- own 11% stake in the company, and hence can't easily be ignored. While this size of ownership may not be enough to sway a policy decision in their favour, they can still make a collective impact on company policies.
Next Steps:
While it is well worth considering the different groups that own a company, there are other factors that are even more important. Take risks for example - Aspen Pharmacare Holdings has 1 warning sign we think you should be aware of.
If you are like me, you may want to think about whether this company will grow or shrink. Luckily, you can check this free report showing analyst forecasts for its future.
NB: Figures in this article are calculated using data from the last twelve months, which refer to the 12-month period ending on the last date of the month the financial statement is dated. This may not be consistent with full year annual report figures.
Have feedback on this article? Concerned about the content? Get in touch with us directly. Alternatively, email editorial-team (at) simplywallst.com.
This article by Simply Wall St is general in nature. We provide commentary based on historical data and analyst forecasts only using an unbiased methodology and our articles are not intended to be financial advice. It does not constitute a recommendation to buy or sell any stock, and does not take account of your objectives, or your financial situation. We aim to bring you long-term focused analysis driven by fundamental data. Note that our analysis may not factor in the latest price-sensitive company announcements or qualitative material. Simply Wall St has no position in any stocks mentioned.