
- LIVE QUOTES
- LEARN
- HELP
 Wall Street Journal
EN
Brightstar Resources Limited's (ASX:BTR) market cap surged AU$23m last week, individual investors who have a lot riding on the company were rewarded
Key Insights
- Significant control over Brightstar Resources by individual investors implies that the general public has more power to influence management and governance-related decisions
- 42% of the business is held by the top 25 shareholders
- Using data from company's past performance alongside ownership research, one can better assess the future performance of a company
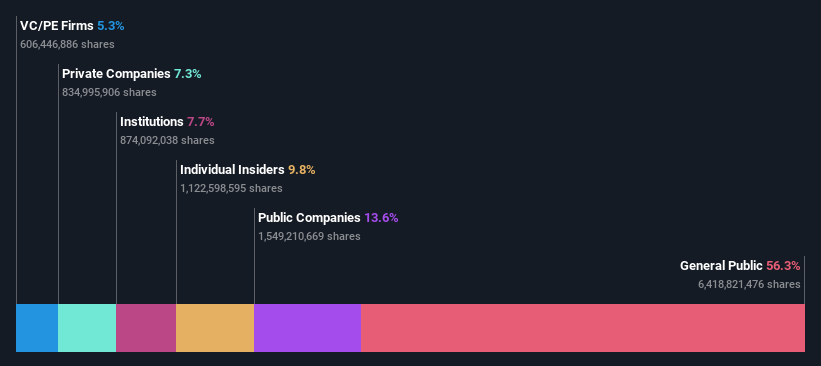
Every investor in Brightstar Resources Limited (ASX:BTR) should be aware of the most powerful shareholder groups. The group holding the most number of shares in the company, around 56% to be precise, is individual investors. That is, the group stands to benefit the most if the stock rises (or lose the most if there is a downturn).
Clearly, individual investors benefitted the most after the company's market cap rose by AU$23m last week.
In the chart below, we zoom in on the different ownership groups of Brightstar Resources.
Check out our latest analysis for Brightstar Resources
What Does The Institutional Ownership Tell Us About Brightstar Resources?
Institutions typically measure themselves against a benchmark when reporting to their own investors, so they often become more enthusiastic about a stock once it's included in a major index. We would expect most companies to have some institutions on the register, especially if they are growing.
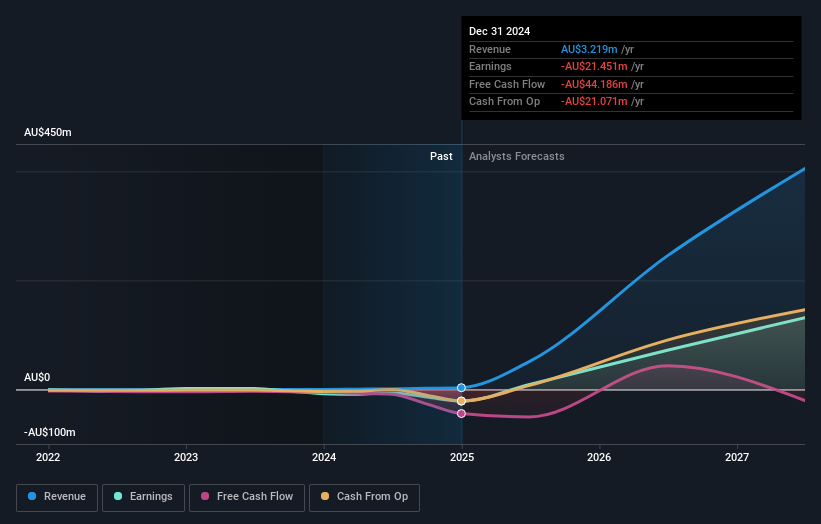
We can see that Brightstar Resources does have institutional investors; and they hold a good portion of the company's stock. This implies the analysts working for those institutions have looked at the stock and they like it. But just like anyone else, they could be wrong. When multiple institutions own a stock, there's always a risk that they are in a 'crowded trade'. When such a trade goes wrong, multiple parties may compete to sell stock fast. This risk is higher in a company without a history of growth. You can see Brightstar Resources' historic earnings and revenue below, but keep in mind there's always more to the story.
Hedge funds don't have many shares in Brightstar Resources. St Barbara Limited is currently the company's largest shareholder with 5.6% of shares outstanding. The second and third largest shareholders are Lion Manager Pty Ltd and Jack Yetiv, with an equal amount of shares to their name at 5.3%.
Our studies suggest that the top 25 shareholders collectively control less than half of the company's shares, meaning that the company's shares are widely disseminated and there is no dominant shareholder.
Researching institutional ownership is a good way to gauge and filter a stock's expected performance. The same can be achieved by studying analyst sentiments. There is a little analyst coverage of the stock, but not much. So there is room for it to gain more coverage.
Insider Ownership Of Brightstar Resources
The definition of company insiders can be subjective and does vary between jurisdictions. Our data reflects individual insiders, capturing board members at the very least. Management ultimately answers to the board. However, it is not uncommon for managers to be executive board members, especially if they are a founder or the CEO.
Most consider insider ownership a positive because it can indicate the board is well aligned with other shareholders. However, on some occasions too much power is concentrated within this group.
Shareholders would probably be interested to learn that insiders own shares in Brightstar Resources Limited. As individuals, the insiders collectively own AU$25m worth of the AU$251m company. Some would say this shows alignment of interests between shareholders and the board, though we generally prefer to see bigger insider holdings. But it might be worth checking if those insiders have been selling.
General Public Ownership
The general public -- including retail investors -- own 56% of Brightstar Resources. This size of ownership gives investors from the general public some collective power. They can and probably do influence decisions on executive compensation, dividend policies and proposed business acquisitions.
Private Equity Ownership
With a stake of 5.3%, private equity firms could influence the Brightstar Resources board. Some investors might be encouraged by this, since private equity are sometimes able to encourage strategies that help the market see the value in the company. Alternatively, those holders might be exiting the investment after taking it public.
Private Company Ownership
Our data indicates that Private Companies hold 7.3%, of the company's shares. Private companies may be related parties. Sometimes insiders have an interest in a public company through a holding in a private company, rather than in their own capacity as an individual. While it's hard to draw any broad stroke conclusions, it is worth noting as an area for further research.
Public Company Ownership
We can see that public companies hold 14% of the Brightstar Resources shares on issue. We can't be certain but it is quite possible this is a strategic stake. The businesses may be similar, or work together.
Next Steps:
I find it very interesting to look at who exactly owns a company. But to truly gain insight, we need to consider other information, too. Like risks, for instance. Every company has them, and we've spotted 3 warning signs for Brightstar Resources (of which 2 are potentially serious!) you should know about.
If you are like me, you may want to think about whether this company will grow or shrink. Luckily, you can check this free report showing analyst forecasts for its future.
NB: Figures in this article are calculated using data from the last twelve months, which refer to the 12-month period ending on the last date of the month the financial statement is dated. This may not be consistent with full year annual report figures.
Have feedback on this article? Concerned about the content? Get in touch with us directly. Alternatively, email editorial-team (at) simplywallst.com.
This article by Simply Wall St is general in nature. We provide commentary based on historical data and analyst forecasts only using an unbiased methodology and our articles are not intended to be financial advice. It does not constitute a recommendation to buy or sell any stock, and does not take account of your objectives, or your financial situation. We aim to bring you long-term focused analysis driven by fundamental data. Note that our analysis may not factor in the latest price-sensitive company announcements or qualitative material. Simply Wall St has no position in any stocks mentioned.