
- LIVE QUOTES
- LEARN
- HELP


EN
While individual investors own 35% of Mitsubishi Motors Corporation (TSE:7211), public companies are its largest shareholders with 53% ownership
Key Insights
- Mitsubishi Motors' significant public companies ownership suggests that the key decisions are influenced by shareholders from the larger public
- A total of 3 investors have a majority stake in the company with 51% ownership
- 12% of Mitsubishi Motors is held by Institutions
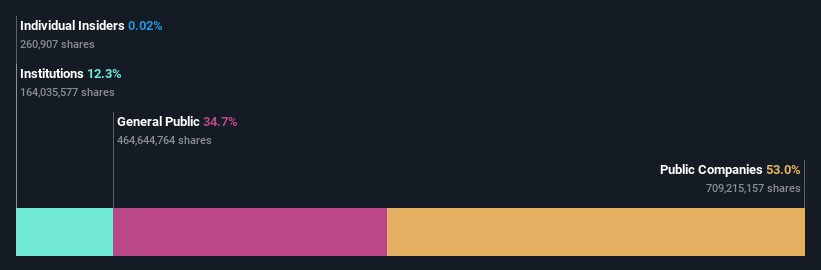
To get a sense of who is truly in control of Mitsubishi Motors Corporation (TSE:7211), it is important to understand the ownership structure of the business. And the group that holds the biggest piece of the pie are public companies with 53% ownership. That is, the group stands to benefit the most if the stock rises (or lose the most if there is a downturn).
Individual investors, on the other hand, account for 35% of the company's stockholders.
Let's delve deeper into each type of owner of Mitsubishi Motors, beginning with the chart below.
Check out our latest analysis for Mitsubishi Motors
What Does The Institutional Ownership Tell Us About Mitsubishi Motors?
Institutions typically measure themselves against a benchmark when reporting to their own investors, so they often become more enthusiastic about a stock once it's included in a major index. We would expect most companies to have some institutions on the register, especially if they are growing.
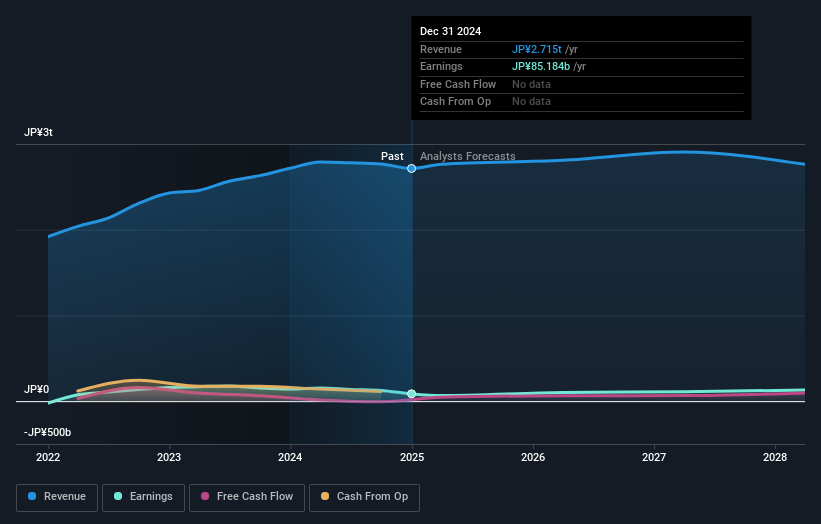
We can see that Mitsubishi Motors does have institutional investors; and they hold a good portion of the company's stock. This implies the analysts working for those institutions have looked at the stock and they like it. But just like anyone else, they could be wrong. It is not uncommon to see a big share price drop if two large institutional investors try to sell out of a stock at the same time. So it is worth checking the past earnings trajectory of Mitsubishi Motors, (below). Of course, keep in mind that there are other factors to consider, too.
We note that hedge funds don't have a meaningful investment in Mitsubishi Motors. Our data shows that Nissan Motor Co., Ltd. is the largest shareholder with 27% of shares outstanding. In comparison, the second and third largest shareholders hold about 22% and 2.3% of the stock.
A more detailed study of the shareholder registry showed us that 3 of the top shareholders have a considerable amount of ownership in the company, via their 51% stake.
While it makes sense to study institutional ownership data for a company, it also makes sense to study analyst sentiments to know which way the wind is blowing. There are plenty of analysts covering the stock, so it might be worth seeing what they are forecasting, too.
Insider Ownership Of Mitsubishi Motors
While the precise definition of an insider can be subjective, almost everyone considers board members to be insiders. Management ultimately answers to the board. However, it is not uncommon for managers to be executive board members, especially if they are a founder or the CEO.
Insider ownership is positive when it signals leadership are thinking like the true owners of the company. However, high insider ownership can also give immense power to a small group within the company. This can be negative in some circumstances.
Our most recent data indicates that insiders own less than 1% of Mitsubishi Motors Corporation. It is a pretty big company, so it would be possible for board members to own a meaningful interest in the company, without owning much of a proportional interest. In this case, they own around JP¥95m worth of shares (at current prices). Arguably, recent buying and selling is just as important to consider. You can click here to see if insiders have been buying or selling.
General Public Ownership
The general public-- including retail investors -- own 35% stake in the company, and hence can't easily be ignored. While this size of ownership may not be enough to sway a policy decision in their favour, they can still make a collective impact on company policies.
Public Company Ownership
It appears to us that public companies own 53% of Mitsubishi Motors. We can't be certain but it is quite possible this is a strategic stake. The businesses may be similar, or work together.
Next Steps:
It's always worth thinking about the different groups who own shares in a company. But to understand Mitsubishi Motors better, we need to consider many other factors. Consider for instance, the ever-present spectre of investment risk. We've identified 3 warning signs with Mitsubishi Motors , and understanding them should be part of your investment process.
But ultimately it is the future, not the past, that will determine how well the owners of this business will do. Therefore we think it advisable to take a look at this free report showing whether analysts are predicting a brighter future .
NB: Figures in this article are calculated using data from the last twelve months, which refer to the 12-month period ending on the last date of the month the financial statement is dated. This may not be consistent with full year annual report figures.
Have feedback on this article? Concerned about the content? Get in touch with us directly. Alternatively, email editorial-team (at) simplywallst.com.
This article by Simply Wall St is general in nature. We provide commentary based on historical data and analyst forecasts only using an unbiased methodology and our articles are not intended to be financial advice. It does not constitute a recommendation to buy or sell any stock, and does not take account of your objectives, or your financial situation. We aim to bring you long-term focused analysis driven by fundamental data. Note that our analysis may not factor in the latest price-sensitive company announcements or qualitative material. Simply Wall St has no position in any stocks mentioned.