
- LIVE QUOTES
- LEARN
- HELP
 Wall Street Journal
EN
Axial Retailing's (TSE:8255) 11% CAGR outpaced the company's earnings growth over the same three-year period
By buying an index fund, investors can approximate the average market return. But if you pick the right individual stocks, you could make more than that. For example, the Axial Retailing Inc. (TSE:8255) share price is up 29% in the last three years, clearly besting the market return of around 21% (not including dividends). On the other hand, the returns haven't been quite so good recently, with shareholders up just 3.4%, including dividends.
Since the stock has added JP¥8.9b to its market cap in the past week alone, let's see if underlying performance has been driving long-term returns.
To quote Buffett, 'Ships will sail around the world but the Flat Earth Society will flourish. There will continue to be wide discrepancies between price and value in the marketplace...' One imperfect but simple way to consider how the market perception of a company has shifted is to compare the change in the earnings per share (EPS) with the share price movement.
During three years of share price growth, Axial Retailing achieved compound earnings per share growth of 1.1% per year. In comparison, the 9% per year gain in the share price outpaces the EPS growth. This suggests that, as the business progressed over the last few years, it gained the confidence of market participants. That's not necessarily surprising considering the three-year track record of earnings growth.
The graphic below depicts how EPS has changed over time (unveil the exact values by clicking on the image).
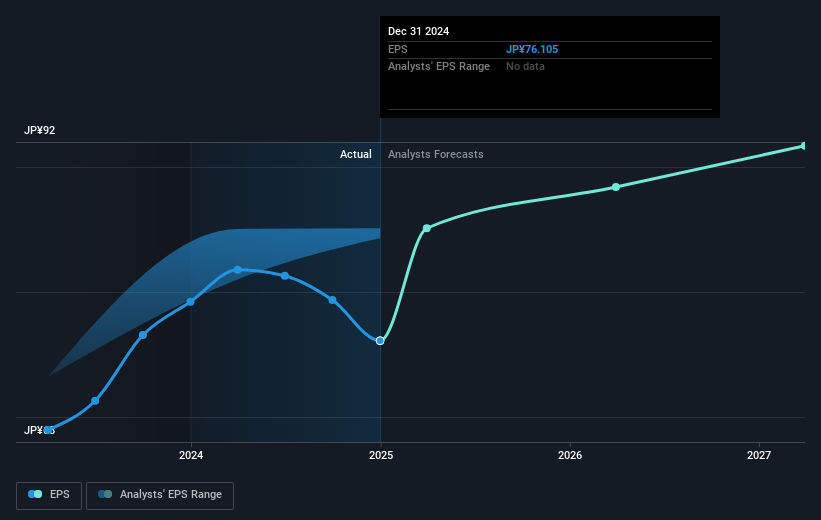
It might be well worthwhile taking a look at our free report on Axial Retailing's earnings, revenue and cash flow .
What About Dividends?
When looking at investment returns, it is important to consider the difference between total shareholder return (TSR) and share price return. Whereas the share price return only reflects the change in the share price, the TSR includes the value of dividends (assuming they were reinvested) and the benefit of any discounted capital raising or spin-off. Arguably, the TSR gives a more comprehensive picture of the return generated by a stock. In the case of Axial Retailing, it has a TSR of 39% for the last 3 years. That exceeds its share price return that we previously mentioned. This is largely a result of its dividend payments!
A Different Perspective
It's good to see that Axial Retailing has rewarded shareholders with a total shareholder return of 3.4% in the last twelve months. Of course, that includes the dividend. However, the TSR over five years, coming in at 4% per year, is even more impressive. Is Axial Retailing cheap compared to other companies? These 3 valuation measures might help you decide.
But note: Axial Retailing may not be the best stock to buy. So take a peek at this free list of interesting companies with past earnings growth (and further growth forecast).
Please note, the market returns quoted in this article reflect the market weighted average returns of stocks that currently trade on Japanese exchanges.
Have feedback on this article? Concerned about the content? Get in touch with us directly. Alternatively, email editorial-team (at) simplywallst.com.
This article by Simply Wall St is general in nature. We provide commentary based on historical data and analyst forecasts only using an unbiased methodology and our articles are not intended to be financial advice. It does not constitute a recommendation to buy or sell any stock, and does not take account of your objectives, or your financial situation. We aim to bring you long-term focused analysis driven by fundamental data. Note that our analysis may not factor in the latest price-sensitive company announcements or qualitative material. Simply Wall St has no position in any stocks mentioned.