
- LIVE QUOTES
- LEARN
- HELP
 Wall Street Journal
EN
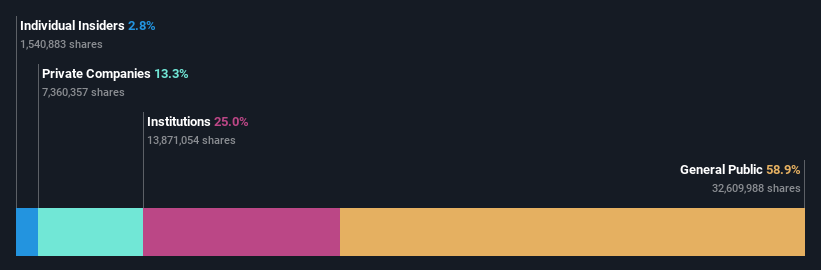
Individual investors who have a significant stake must be disappointed along with institutions after Nexity SA's (EPA:NXI) market cap dropped by €65m
Key Insights
- Nexity's significant individual investors ownership suggests that the key decisions are influenced by shareholders from the larger public
- 43% of the business is held by the top 25 shareholders
- 25% of Nexity is held by Institutions
If you want to know who really controls Nexity SA (EPA:NXI), then you'll have to look at the makeup of its share registry. We can see that individual investors own the lion's share in the company with 59% ownership. Put another way, the group faces the maximum upside potential (or downside risk).
While the holdings of individual investors took a hit after last week’s 12% price drop, institutions with their 25% holdings also suffered.
Let's delve deeper into each type of owner of Nexity, beginning with the chart below.
See our latest analysis for Nexity
What Does The Institutional Ownership Tell Us About Nexity?
Institutional investors commonly compare their own returns to the returns of a commonly followed index. So they generally do consider buying larger companies that are included in the relevant benchmark index.
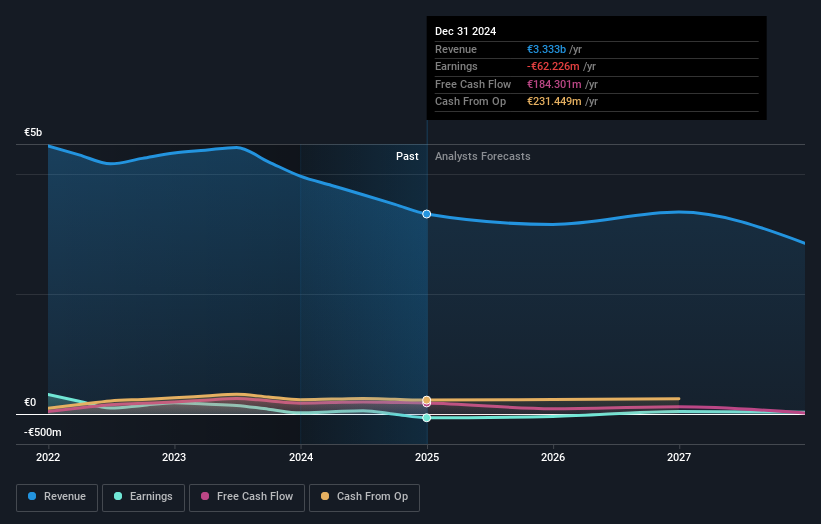
We can see that Nexity does have institutional investors; and they hold a good portion of the company's stock. This can indicate that the company has a certain degree of credibility in the investment community. However, it is best to be wary of relying on the supposed validation that comes with institutional investors. They too, get it wrong sometimes. When multiple institutions own a stock, there's always a risk that they are in a 'crowded trade'. When such a trade goes wrong, multiple parties may compete to sell stock fast. This risk is higher in a company without a history of growth. You can see Nexity's historic earnings and revenue below, but keep in mind there's always more to the story.
We note that hedge funds don't have a meaningful investment in Nexity. Crédit Mutuel Group is currently the largest shareholder, with 6.8% of shares outstanding. Meanwhile, the second and third largest shareholders, hold 6.0% and 5.1%, of the shares outstanding, respectively.
Our studies suggest that the top 25 shareholders collectively control less than half of the company's shares, meaning that the company's shares are widely disseminated and there is no dominant shareholder.
While it makes sense to study institutional ownership data for a company, it also makes sense to study analyst sentiments to know which way the wind is blowing. Quite a few analysts cover the stock, so you could look into forecast growth quite easily.
Insider Ownership Of Nexity
The definition of an insider can differ slightly between different countries, but members of the board of directors always count. The company management answer to the board and the latter should represent the interests of shareholders. Notably, sometimes top-level managers are on the board themselves.
I generally consider insider ownership to be a good thing. However, on some occasions it makes it more difficult for other shareholders to hold the board accountable for decisions.
Shareholders would probably be interested to learn that insiders own shares in Nexity SA. It has a market capitalization of just €493m, and insiders have €14m worth of shares, in their own names. Some would say this shows alignment of interests between shareholders and the board. But it might be worth checking if those insiders have been selling.
General Public Ownership
The general public, mostly comprising of individual investors, collectively holds 59% of Nexity shares. This level of ownership gives investors from the wider public some power to sway key policy decisions such as board composition, executive compensation, and the dividend payout ratio.
Private Company Ownership
It seems that Private Companies own 13%, of the Nexity stock. It might be worth looking deeper into this. If related parties, such as insiders, have an interest in one of these private companies, that should be disclosed in the annual report. Private companies may also have a strategic interest in the company.
Next Steps:
It's always worth thinking about the different groups who own shares in a company. But to understand Nexity better, we need to consider many other factors. Take risks for example - Nexity has 1 warning sign we think you should be aware of.
If you are like me, you may want to think about whether this company will grow or shrink. Luckily, you can check this free report showing analyst forecasts for its future .
NB: Figures in this article are calculated using data from the last twelve months, which refer to the 12-month period ending on the last date of the month the financial statement is dated. This may not be consistent with full year annual report figures.
Have feedback on this article? Concerned about the content? Get in touch with us directly. Alternatively, email editorial-team (at) simplywallst.com.
This article by Simply Wall St is general in nature. We provide commentary based on historical data and analyst forecasts only using an unbiased methodology and our articles are not intended to be financial advice. It does not constitute a recommendation to buy or sell any stock, and does not take account of your objectives, or your financial situation. We aim to bring you long-term focused analysis driven by fundamental data. Note that our analysis may not factor in the latest price-sensitive company announcements or qualitative material. Simply Wall St has no position in any stocks mentioned.