
- LIVE QUOTES
- LEARN
- HELP
 Wall Street Journal
EN
Kier Group's (LON:KIE) earnings growth rate lags the 15% CAGR delivered to shareholders
Kier Group plc (LON:KIE) shareholders might be concerned after seeing the share price drop 20% in the last quarter. But that doesn't change the fact that the returns over the last three years have been pleasing. In fact, the company's share price bested the return of its market index in that time, posting a gain of 46%.
While the stock has fallen 10% this week, it's worth focusing on the longer term and seeing if the stocks historical returns have been driven by the underlying fundamentals.
In his essay The Superinvestors of Graham-and-Doddsville Warren Buffett described how share prices do not always rationally reflect the value of a business. One imperfect but simple way to consider how the market perception of a company has shifted is to compare the change in the earnings per share (EPS) with the share price movement.
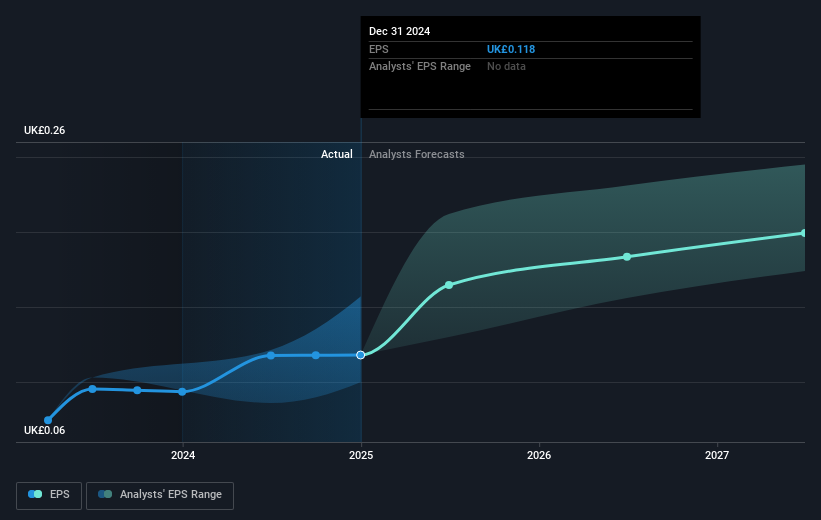
Kier Group was able to grow its EPS at 13% per year over three years, sending the share price higher. Notably, the 13% average annual share price gain matches up nicely with the EPS growth rate. This observation indicates that the market's attitude to the business hasn't changed all that much. Rather, the share price has approximately tracked EPS growth.
You can see how EPS has changed over time in the image below (click on the chart to see the exact values).
We know that Kier Group has improved its bottom line lately, but is it going to grow revenue? This free report showing analyst revenue forecasts should help you figure out if the EPS growth can be sustained.
What About Dividends?
When looking at investment returns, it is important to consider the difference between total shareholder return (TSR) and share price return. The TSR is a return calculation that accounts for the value of cash dividends (assuming that any dividend received was reinvested) and the calculated value of any discounted capital raisings and spin-offs. It's fair to say that the TSR gives a more complete picture for stocks that pay a dividend. We note that for Kier Group the TSR over the last 3 years was 51%, which is better than the share price return mentioned above. The dividends paid by the company have thusly boosted the total shareholder return.
A Different Perspective
Investors in Kier Group had a tough year, with a total loss of 3.3% (including dividends), against a market gain of about 3.3%. However, keep in mind that even the best stocks will sometimes underperform the market over a twelve month period. On the bright side, long term shareholders have made money, with a gain of 11% per year over half a decade. If the fundamental data continues to indicate long term sustainable growth, the current sell-off could be an opportunity worth considering. It's always interesting to track share price performance over the longer term. But to understand Kier Group better, we need to consider many other factors. Case in point: We've spotted 1 warning sign for Kier Group you should be aware of.
Of course Kier Group may not be the best stock to buy. So you may wish to see this free collection of growth stocks.
Please note, the market returns quoted in this article reflect the market weighted average returns of stocks that currently trade on British exchanges.
Have feedback on this article? Concerned about the content? Get in touch with us directly. Alternatively, email editorial-team (at) simplywallst.com.
This article by Simply Wall St is general in nature. We provide commentary based on historical data and analyst forecasts only using an unbiased methodology and our articles are not intended to be financial advice. It does not constitute a recommendation to buy or sell any stock, and does not take account of your objectives, or your financial situation. We aim to bring you long-term focused analysis driven by fundamental data. Note that our analysis may not factor in the latest price-sensitive company announcements or qualitative material. Simply Wall St has no position in any stocks mentioned.