
- LIVE QUOTES
- LEARN
- HELP
 Wall Street Journal
EN
Itoki (TSE:7972) pulls back 12% this week, but still delivers shareholders massive 42% CAGR over 5 years
The Itoki Corporation (TSE:7972) share price has had a bad week, falling 12%. But that doesn't undermine the fantastic longer term performance (measured over five years). In fact, during that period, the share price climbed 361%. Impressive! So we don't think the recent decline in the share price means its story is a sad one. Of course what matters most is whether the business can improve itself sustainably, thus justifying a higher price. Unfortunately not all shareholders will have held it for the long term, so spare a thought for those caught in the 18% decline over the last twelve months.
While the stock has fallen 12% this week, it's worth focusing on the longer term and seeing if the stocks historical returns have been driven by the underlying fundamentals.
In his essay The Superinvestors of Graham-and-Doddsville Warren Buffett described how share prices do not always rationally reflect the value of a business. One flawed but reasonable way to assess how sentiment around a company has changed is to compare the earnings per share (EPS) with the share price.
During the five years of share price growth, Itoki moved from a loss to profitability. That kind of transition can be an inflection point that justifies a strong share price gain, just as we have seen here. Given that the company made a profit three years ago, but not five years ago, it is worth looking at the share price returns over the last three years, too. Indeed, the Itoki share price has gained 338% in three years. During the same period, EPS grew by 78% each year. This EPS growth is higher than the 64% average annual increase in the share price over the same three years. So you might conclude the market is a little more cautious about the stock, these days. This cautious sentiment is reflected in its (fairly low) P/E ratio of 10.17.
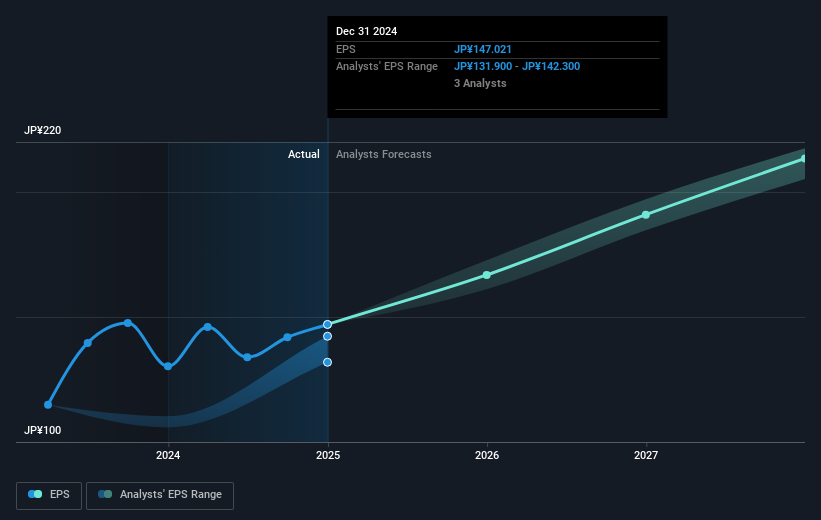
You can see how EPS has changed over time in the image below (click on the chart to see the exact values).
We know that Itoki has improved its bottom line over the last three years, but what does the future have in store? If you are thinking of buying or selling Itoki stock, you should check out this FREE detailed report on its balance sheet .
What About Dividends?
When looking at investment returns, it is important to consider the difference between total shareholder return (TSR) and share price return. The TSR incorporates the value of any spin-offs or discounted capital raisings, along with any dividends, based on the assumption that the dividends are reinvested. It's fair to say that the TSR gives a more complete picture for stocks that pay a dividend. We note that for Itoki the TSR over the last 5 years was 467%, which is better than the share price return mentioned above. The dividends paid by the company have thusly boosted the total shareholder return.
A Different Perspective
We regret to report that Itoki shareholders are down 15% for the year (even including dividends). Unfortunately, that's worse than the broader market decline of 3.9%. Having said that, it's inevitable that some stocks will be oversold in a falling market. The key is to keep your eyes on the fundamental developments. On the bright side, long term shareholders have made money, with a gain of 42% per year over half a decade. If the fundamental data continues to indicate long term sustainable growth, the current sell-off could be an opportunity worth considering. It's always interesting to track share price performance over the longer term. But to understand Itoki better, we need to consider many other factors. Like risks, for instance. Every company has them, and we've spotted 3 warning signs for Itoki (of which 1 is significant!) you should know about.
If you like to buy stocks alongside management, then you might just love this free list of companies. (Hint: many of them are unnoticed AND have attractive valuation).
Please note, the market returns quoted in this article reflect the market weighted average returns of stocks that currently trade on Japanese exchanges.
Have feedback on this article? Concerned about the content? Get in touch with us directly. Alternatively, email editorial-team (at) simplywallst.com.
This article by Simply Wall St is general in nature. We provide commentary based on historical data and analyst forecasts only using an unbiased methodology and our articles are not intended to be financial advice. It does not constitute a recommendation to buy or sell any stock, and does not take account of your objectives, or your financial situation. We aim to bring you long-term focused analysis driven by fundamental data. Note that our analysis may not factor in the latest price-sensitive company announcements or qualitative material. Simply Wall St has no position in any stocks mentioned.