
- LIVE QUOTES
- LEARN
- HELP
 Wall Street Journal
EN
3 Promising Penny Stocks With Market Caps Under $19B
The U.S. stock market recently experienced a surge, driven by positive investor sentiment following reports that the Trump administration may reduce certain tariffs, boosting major indices like the S&P 500 and Nasdaq Composite. Amidst this backdrop, investors are increasingly looking for opportunities in lesser-known sectors of the market. Penny stocks, often associated with smaller or newer companies, remain an intriguing investment area due to their potential for growth at lower price points. When these stocks are supported by strong financial fundamentals, they can present unique opportunities for significant returns.
Top 10 Penny Stocks In The United States
| Name | Share Price | Market Cap | Rewards & Risks |
| Safe Bulkers (NYSE:SB) | $3.75 | $392.12M | ✅ 3 ⚠️ 3 View Analysis > |
| Tuya (NYSE:TUYA) | $3.50 | $2.08B | ✅ 3 ⚠️ 3 View Analysis > |
| Cango (NYSE:CANG) | $4.38 | $424.77M | ✅ 4 ⚠️ 1 View Analysis > |
| Sensus Healthcare (NasdaqCM:SRTS) | $4.81 | $77.69M | ✅ 5 ⚠️ 3 View Analysis > |
| Golden Growers Cooperative (OTCPK:GGRO.U) | $4.50 | $67.38M | ✅ 1 ⚠️ 5 View Analysis > |
| TETRA Technologies (NYSE:TTI) | $3.53 | $443.52M | ✅ 5 ⚠️ 2 View Analysis > |
| Imperial Petroleum (NasdaqCM:IMPP) | $2.55 | $77.35M | ✅ 3 ⚠️ 1 View Analysis > |
| BAB (OTCPK:BABB) | $0.81 | $6.17M | ✅ 2 ⚠️ 3 View Analysis > |
| QuantaSing Group (NasdaqGM:QSG) | $3.08 | $140.05M | ✅ 3 ⚠️ 1 View Analysis > |
| CBAK Energy Technology (NasdaqCM:CBAT) | $0.859 | $73.78M | ✅ 4 ⚠️ 1 View Analysis > |
Click here to see the full list of 757 stocks from our US Penny Stocks screener.
Here's a peek at a few of the choices from the screener.
Grab Holdings (NasdaqGS:GRAB)
Simply Wall St Financial Health Rating: ★★★★★★
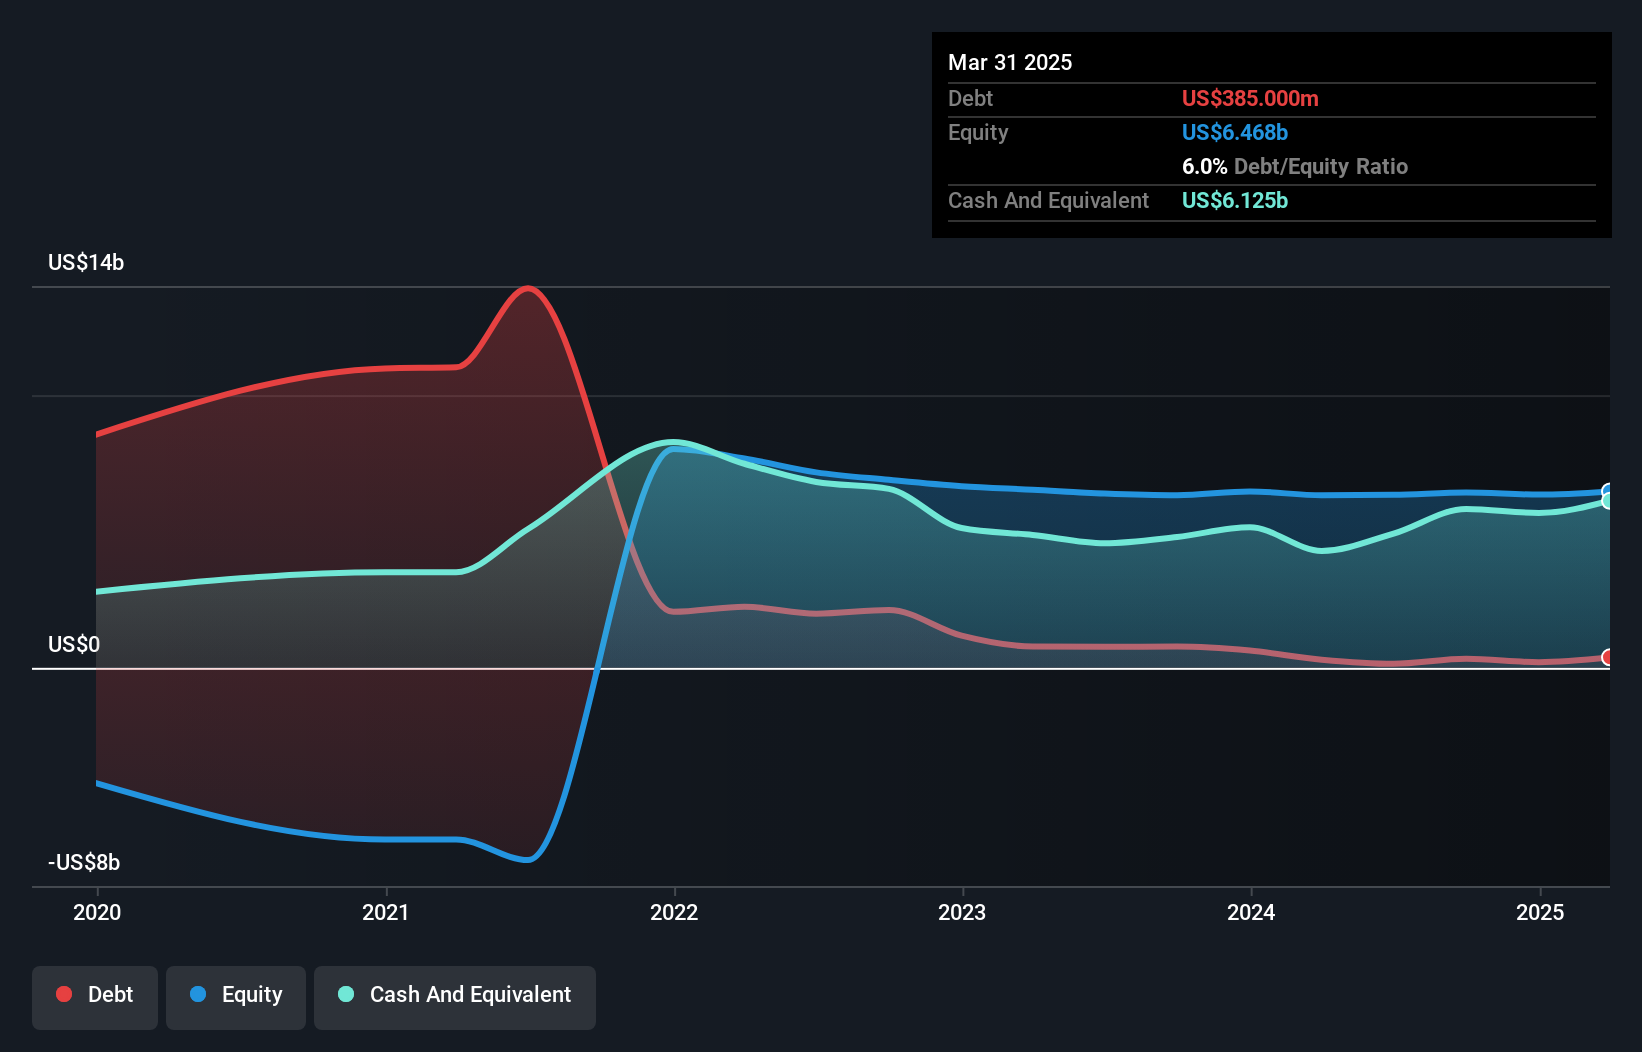
Overview: Grab Holdings Limited operates as a superapp provider across Southeast Asia, offering services in transportation, food delivery, and digital payments with a market capitalization of approximately $18.89 billion.
Operations: The company's revenue is primarily derived from its Deliveries segment at $1.49 billion, followed by Mobility at $1.05 billion and Financial Services contributing $253 million.
Market Cap: $18.89B
Grab Holdings, a superapp provider in Southeast Asia, has been making significant strides despite its unprofitable status. With a market cap of US$18.89 billion, its revenue is driven by the Deliveries and Mobility segments. The company has improved financial health with positive shareholder equity and more cash than debt. Recent developments include being added to the NASDAQ Internet Index and ongoing merger discussions with GoTo Group, although no deal is confirmed yet. Grab's earnings guidance for 2025 anticipates revenues between US$3.33 billion and US$3.40 billion, reflecting growth from previous years' figures.
- Click here and access our complete financial health analysis report to understand the dynamics of Grab Holdings.
- Gain insights into Grab Holdings' outlook and expected performance with our report on the company's earnings estimates.
Kaltura (NasdaqGS:KLTR)
Simply Wall St Financial Health Rating: ★★★★★★
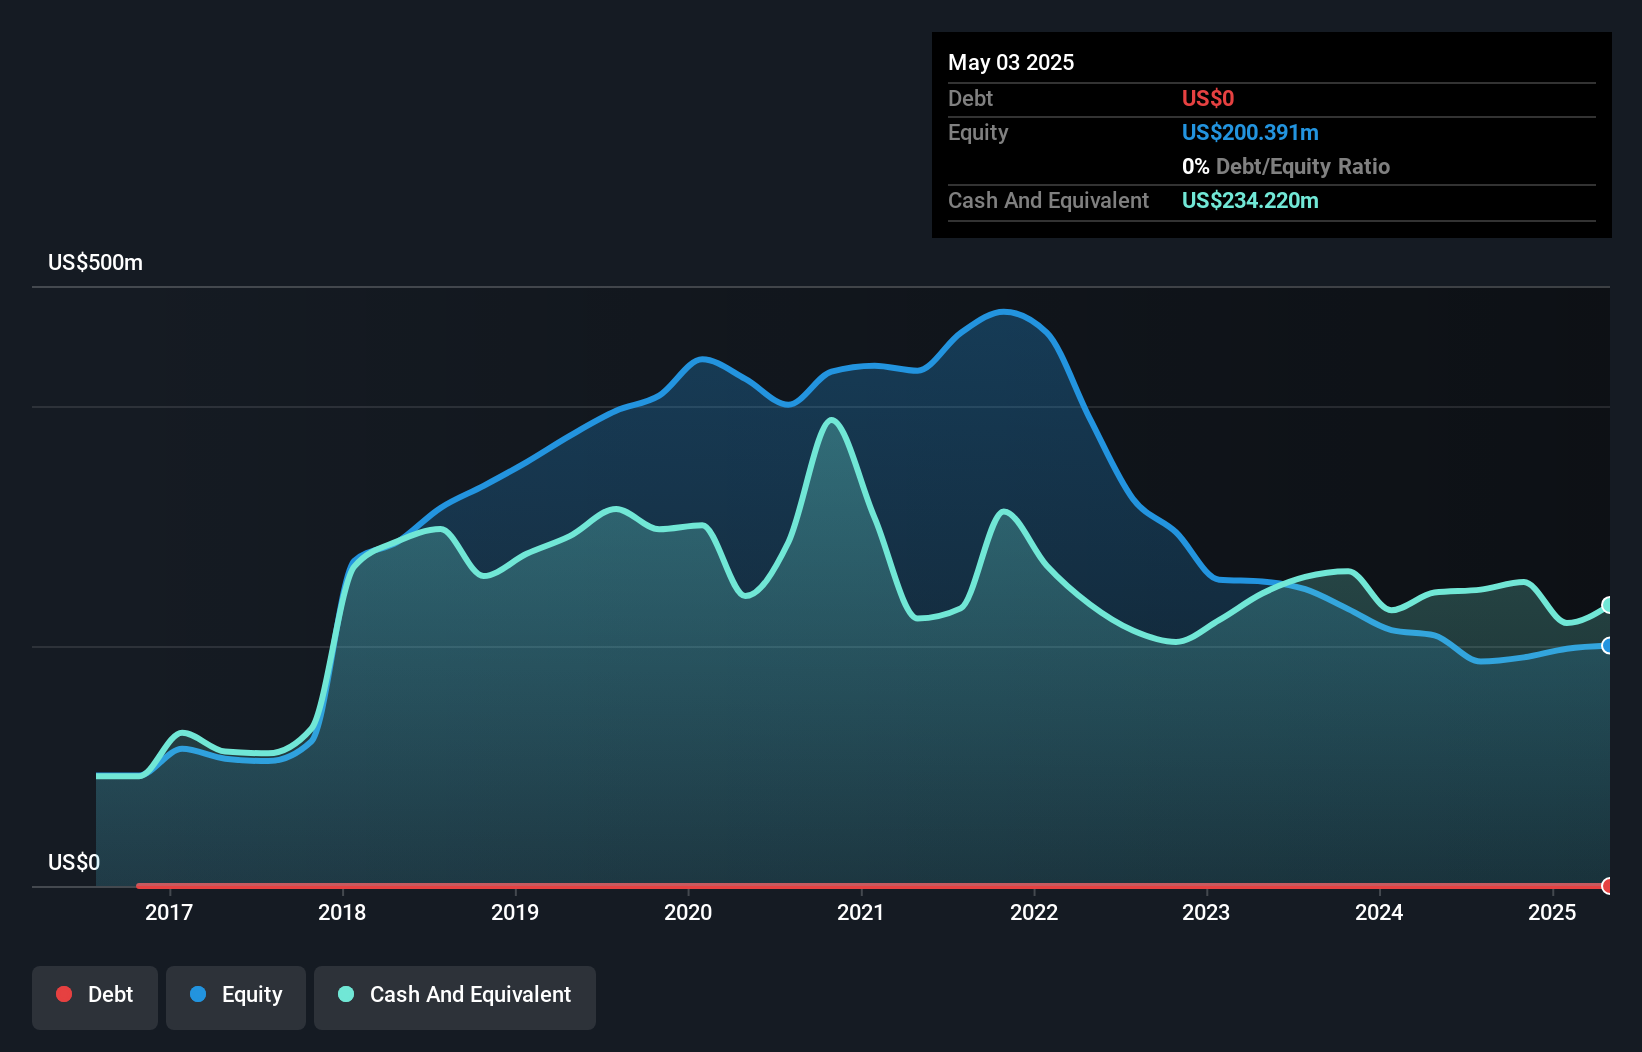
Overview: Kaltura, Inc. offers a range of software-as-a-service (SaaS) and platform-as-a-service (PaaS) solutions globally, with a market cap of approximately $288.24 million.
Operations: The company generates revenue primarily from its Enterprise, Education and Technology segment with $128.70 million and its Media & Telecom segment with $50.01 million.
Market Cap: $288.24M
Kaltura, Inc. has been navigating the penny stock landscape with a market cap of US$288.24 million and an unprofitable status, yet it shows financial resilience with more cash than total debt and sufficient short-term assets to cover liabilities. Recent announcements include a US$15 million share repurchase program funded by existing cash resources, indicating confidence in its financial position despite high share price volatility. While the company has reduced losses over five years at 10.1% annually, profitability remains elusive in the near term as it focuses on revenue growth from its Enterprise and Media segments totaling US$178.72 million for 2024.
- Navigate through the intricacies of Kaltura with our comprehensive balance sheet health report here.
- Evaluate Kaltura's prospects by accessing our earnings growth report.

Stitch Fix (NasdaqGS:SFIX)
Simply Wall St Financial Health Rating: ★★★★★★
Overview: Stitch Fix, Inc. operates an online platform offering personalized apparel, shoes, and accessories for various demographics in the United States with a market cap of approximately $471.40 million.
Operations: The company's revenue is generated from its online retail operations, amounting to $1.27 billion.
Market Cap: $471.4M
Stitch Fix, Inc. operates in the penny stock domain with a market cap of US$471.40 million and remains unprofitable, reporting a net loss of US$6.53 million for the recent quarter despite reducing losses significantly from the previous year. The company is debt-free with short-term assets of US$352.9 million covering both short and long-term liabilities, suggesting financial stability amid its challenges. While management's average tenure is relatively short at 1.8 years, indicating inexperience, Stitch Fix maintains a positive cash flow runway exceeding three years even as it anticipates revenue declines for fiscal year 2025 between US$1.225 billion to US$1.240 billion.
- Click to explore a detailed breakdown of our findings in Stitch Fix's financial health report.
- Review our growth performance report to gain insights into Stitch Fix's future.
Turning Ideas Into Actions
- Get an in-depth perspective on all 757 US Penny Stocks by using our screener here.
- Hold shares in these firms? Setup your portfolio in Simply Wall St to seamlessly track your investments and receive personalized updates on your portfolio's performance.
- Join a community of smart investors by using Simply Wall St. It's free and delivers expert-level analysis on worldwide markets.
Ready For A Different Approach?
- Explore high-performing small cap companies that haven't yet garnered significant analyst attention.
- Jump on the AI train with fast growing tech companies forging a new era of innovation.
- Find companies with promising cash flow potential yet trading below their fair value.
This article by Simply Wall St is general in nature. We provide commentary based on historical data and analyst forecasts only using an unbiased methodology and our articles are not intended to be financial advice. It does not constitute a recommendation to buy or sell any stock, and does not take account of your objectives, or your financial situation. We aim to bring you long-term focused analysis driven by fundamental data. Note that our analysis may not factor in the latest price-sensitive company announcements or qualitative material. Simply Wall St has no position in any stocks mentioned.
Have feedback on this article? Concerned about the content? Get in touch with us directly. Alternatively, email editorial-team@simplywallst.com