
- LIVE QUOTES
- LEARN
- HELP
 Wall Street Journal
EN
Institutional investors control 66% of MFA Financial, Inc. (NYSE:MFA) and were rewarded last week after stock increased 4.7%
Key Insights
- Given the large stake in the stock by institutions, MFA Financial's stock price might be vulnerable to their trading decisions
- The top 16 shareholders own 50% of the company
- Using data from analyst forecasts alongside ownership research, one can better assess the future performance of a company
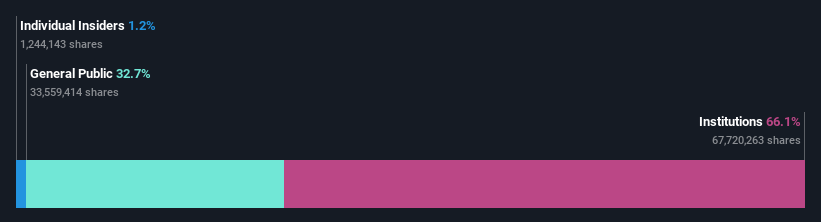
A look at the shareholders of MFA Financial, Inc. (NYSE:MFA) can tell us which group is most powerful. We can see that institutions own the lion's share in the company with 66% ownership. That is, the group stands to benefit the most if the stock rises (or lose the most if there is a downturn).
And as as result, institutional investors reaped the most rewards after the company's stock price gained 4.7% last week. One-year return to shareholders is currently 10% and last week’s gain was the icing on the cake.
In the chart below, we zoom in on the different ownership groups of MFA Financial.
Check out our latest analysis for MFA Financial
What Does The Institutional Ownership Tell Us About MFA Financial?
Institutional investors commonly compare their own returns to the returns of a commonly followed index. So they generally do consider buying larger companies that are included in the relevant benchmark index.
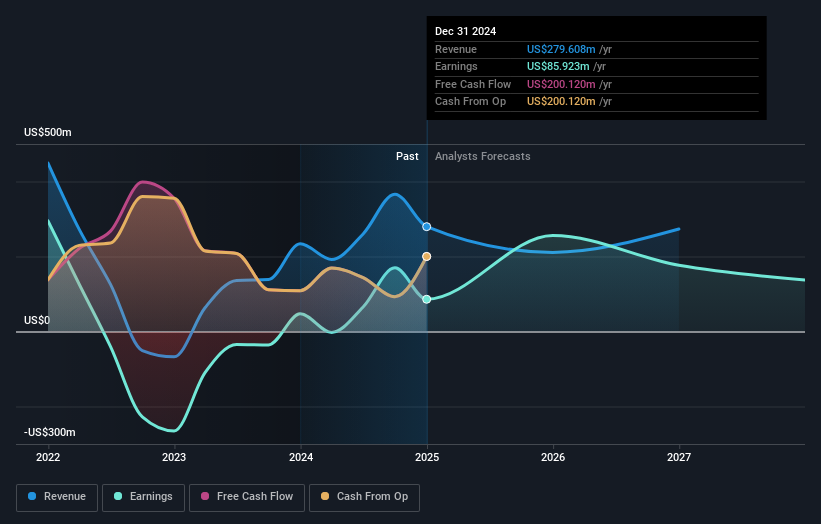
MFA Financial already has institutions on the share registry. Indeed, they own a respectable stake in the company. This suggests some credibility amongst professional investors. But we can't rely on that fact alone since institutions make bad investments sometimes, just like everyone does. When multiple institutions own a stock, there's always a risk that they are in a 'crowded trade'. When such a trade goes wrong, multiple parties may compete to sell stock fast. This risk is higher in a company without a history of growth. You can see MFA Financial's historic earnings and revenue below, but keep in mind there's always more to the story.
Institutional investors own over 50% of the company, so together than can probably strongly influence board decisions. MFA Financial is not owned by hedge funds. Looking at our data, we can see that the largest shareholder is The Vanguard Group, Inc. with 9.9% of shares outstanding. For context, the second largest shareholder holds about 9.5% of the shares outstanding, followed by an ownership of 7.7% by the third-largest shareholder. In addition, we found that Craig Knutson, the CEO has 0.6% of the shares allocated to their name.
Looking at the shareholder registry, we can see that 50% of the ownership is controlled by the top 16 shareholders, meaning that no single shareholder has a majority interest in the ownership.
While studying institutional ownership for a company can add value to your research, it is also a good practice to research analyst recommendations to get a deeper understand of a stock's expected performance. Quite a few analysts cover the stock, so you could look into forecast growth quite easily.
Insider Ownership Of MFA Financial
The definition of company insiders can be subjective and does vary between jurisdictions. Our data reflects individual insiders, capturing board members at the very least. Management ultimately answers to the board. However, it is not uncommon for managers to be executive board members, especially if they are a founder or the CEO.
Most consider insider ownership a positive because it can indicate the board is well aligned with other shareholders. However, on some occasions too much power is concentrated within this group.
Shareholders would probably be interested to learn that insiders own shares in MFA Financial, Inc.. It is a pretty big company, so it is generally a positive to see some potentially meaningful alignment. In this case, they own around US$14m worth of shares (at current prices). Most would say this shows alignment of interests between shareholders and the board. Still, it might be worth checking if those insiders have been selling.
General Public Ownership
The general public, who are usually individual investors, hold a 33% stake in MFA Financial. While this size of ownership may not be enough to sway a policy decision in their favour, they can still make a collective impact on company policies.
Next Steps:
It's always worth thinking about the different groups who own shares in a company. But to understand MFA Financial better, we need to consider many other factors. For example, we've discovered 2 warning signs for MFA Financial (1 is potentially serious!) that you should be aware of before investing here.
If you are like me, you may want to think about whether this company will grow or shrink. Luckily, you can check this free report showing analyst forecasts for its future.
NB: Figures in this article are calculated using data from the last twelve months, which refer to the 12-month period ending on the last date of the month the financial statement is dated. This may not be consistent with full year annual report figures.
Have feedback on this article? Concerned about the content? Get in touch with us directly. Alternatively, email editorial-team (at) simplywallst.com.
This article by Simply Wall St is general in nature. We provide commentary based on historical data and analyst forecasts only using an unbiased methodology and our articles are not intended to be financial advice. It does not constitute a recommendation to buy or sell any stock, and does not take account of your objectives, or your financial situation. We aim to bring you long-term focused analysis driven by fundamental data. Note that our analysis may not factor in the latest price-sensitive company announcements or qualitative material. Simply Wall St has no position in any stocks mentioned.