


Transocean (NYSE:RIG) reports sales below analyst estimates in Q3 2026 earnings

Offshore drilling contractor Transocean (NYSE:RIG) missed Wall Street’s revenue expectations in Q3 2026, with revenue falling 8.9% year on year to $937 million. Its non-GAAP loss of $0 per share was $0.02 below analysts’ consensus estimates.
For more on Transocean, read our free full research report.
Transocean (RIG) Q3 2026 highlights:
- Revenue $937 million vs S&P analysts’ consensus estimates of $943.2 million (8.9% year-on-year decline, 0.7% miss)
- Adjusted EPS $0 vs S&P analysts’ consensus estimates of $0.02 ($0.02 miss)
- Adjusted EBITDA $313 million vs analysts’ consensus estimates of $295.4 million (33.4% margin, 6% beat)
- Operating margin 15.3%, an increase from -163% in the same quarter last year
- Free cash flow margin 14%, a decline from 22.9% in the same quarter last year
- Market capitalization $7.75 billion
“Since our last report, we delivered solid operating results and significantly strengthened forward contract visibility,” said Keelan Adamson, Transocean’s CEO. “Strong cash flow enabled us to retire the remaining $200 million of debt associated with the Deepwater Aquila notes, ahead of schedule. New deepwater and harsh-environment awards increased our backlog to approximately $8.0 billion and improved 2027 contract coverage to approximately 95%.
Revenue growth
Cyclical sectors like energy often flatter weaker operators during favorable price environments, but a longer-term lens separates those from businesses that can consistently perform across market cycles. Over the last five years, Transocean grew its revenue at a tepid 7.1% compounded annual growth rate, falling short of the standard for the energy upstream and integrated energy sector.
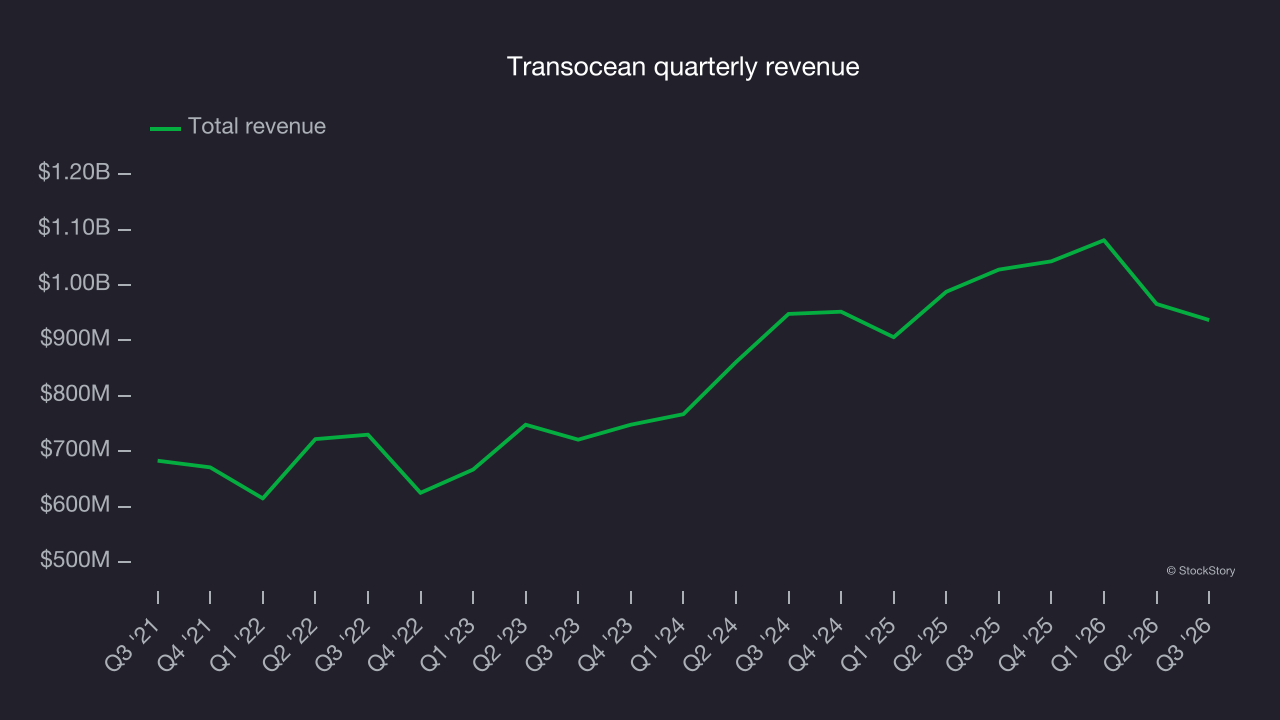
Even a long stretch in energy can be shaped by a single commodity cycle, so extending the view to ten years adds another perspective and reveals which companies can grow across pricing environments. Transocean grew over the past five years but lost ground over the last ten years, as its revenue fell by 2.2% annually.
This quarter, Transocean missed Wall Street’s consensus estimates and reported an uninspiring 8.9% year-on-year revenue decline, generating $937 million in revenue.
Adjusted EBITDA margin
Adjusted EBITDA margin strips out accounting distortions tied to depletion and historical drilling spend, providing a clearer view of the cash-generating power of the underlying asset base before financing and reinvestment decisions.
Transocean was profitable over the last five years but held back by its large cost base. Its average EBITDA margin of 32.1% was weak for an upstream and integrated energy business.
On the positive side, Transocean’s EBITDA margin rose by 1.2 percentage points over the last year.
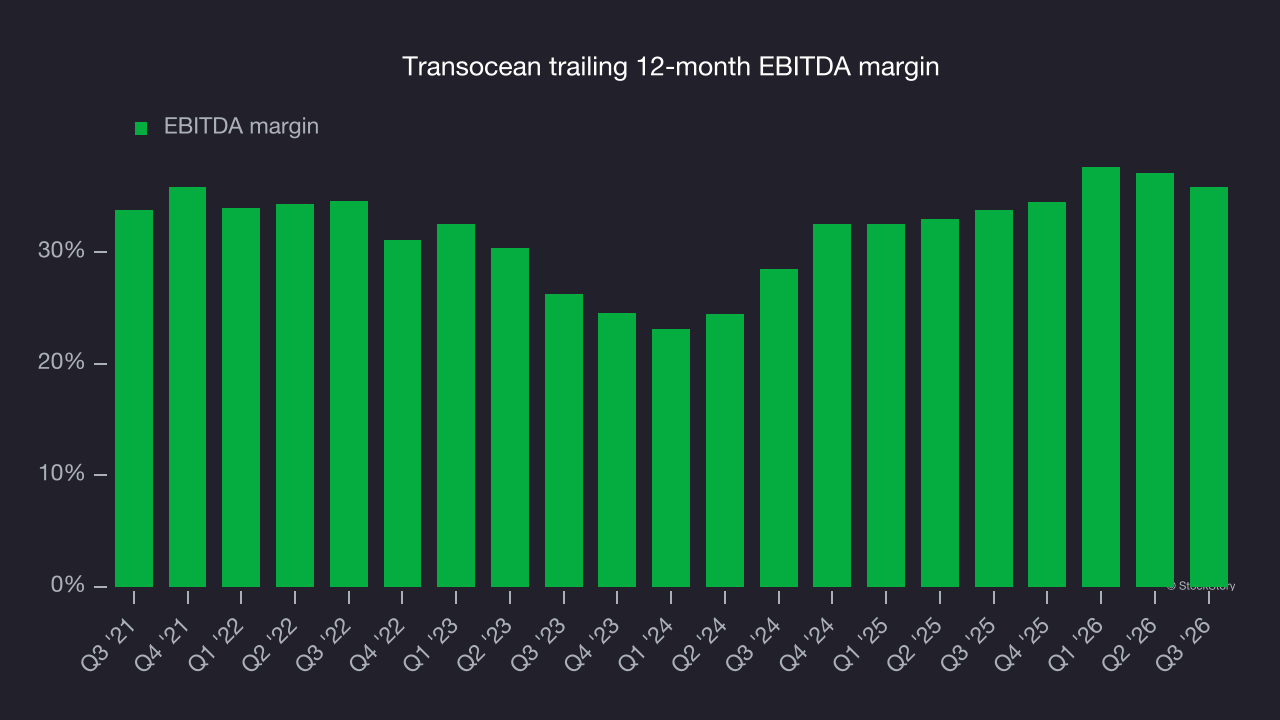
In Q3, Transocean posted an EBITDA margin of 33.4%, down 5.2 percentage points year on year. This contraction shows it was less efficient because its expenses increased relative to its revenue. Its adjusted EBITDA beat Wall Street’s consensus estimates by 6%.
Free cash flow
Adjusted EBITDA shows how profitable a company’s existing wells are before financing and reinvestment decisions, but free cash flow shows how much value remains after paying the cost of replacing those wells. In upstream energy, production naturally declines over time, so companies must continuously reinvest just to stand still. A producer can report strong EBITDA margins yet generate little or no free cash flow if its wells decline quickly or if new drilling is expensive. Free cash flow therefore captures not only how efficiently a company produces hydrocarbons today, but also how costly it is to sustain that production into the future.
Transocean has shown mediocre cash profitability relative to peers over the last five years, giving the company fewer opportunities to return capital to shareholders. Its free cash flow margin averaged 5.3%, below expectations for an upstream and integrated energy business.
While the level of free cash flow margins is important, their consistency matters just as much.
Transocean’s ratio of quarterly free cash flow volatility to West Texas Intermediate, or WTI, crude price volatility over the past five years was 23.5 (lower is better), indicating that its cash generation is far more sensitive to commodity-price swings than most peers. This elevated volatility limits its access to capital in downturns and makes it unlikely to act as a consolidator when weaker competitors come under pressure.
Why assess stability against commodity prices at the free cash flow line? Why not compare revenue or EBITDA with WTI crude prices in Transocean’s case? What ultimately matters is not how much revenue or profit a company earns when prices are high but how much cash it can generate when prices are low. Free cash flow is the superior metric because it includes everything from hedging effectiveness to growth and maintenance capex to management behavior during good times and bad.
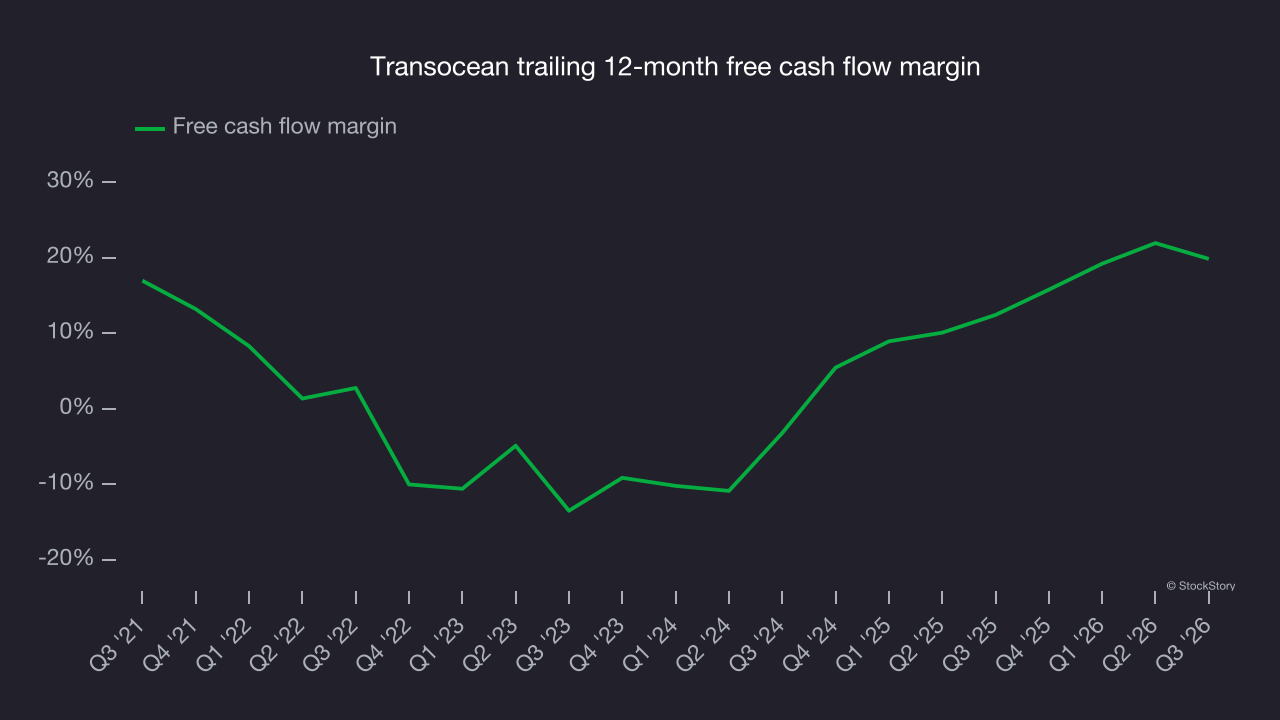
Transocean’s free cash flow totaled $131 million in Q3, equivalent to a 14% margin. The company’s cash profitability declined, with its margin falling 8.9 percentage points from the same quarter last year but remaining above its five-year average. The quarterly decline should be viewed in context because investment needs can be seasonal, leading to short-term swings. Long-term trends carry greater meaning.
Key takeaways from Transocean’s Q3 results
Transocean’s quarter was softer overall, with revenue slightly below Wall Street’s consensus and EPS in line with expectations. EBITDA provided a positive, beating analysts’ consensus estimates. Shares remained flat at $6.29 immediately after the results.
Is Transocean an attractive investment at its current price? The latest quarter is only one part of assessing its longer-term business quality. Quality, combined with valuation, can help determine whether the stock is a buy. Read our full research report here (it’s free).