


What Investors Might Be Missing On Rithm Capital (RITM)
Rithm Capital (RITM) just put fresh numbers on the table, reporting third quarter sales of US$187.04 million and net income of US$253.29 million, including diluted EPS from continuing operations of US$0.38.
The fresh earnings update arrives against a mixed price backdrop for Rithm Capital, with the 30-day share price return up 6.89%. However, the year-to-date move is still down 15.21%, and the latest one-year total shareholder return is lower by 5.77%.
Scan how Rithm Capital compares by lining up its latest move against a curated list of 33 high quality undervalued stocks featuring solid cash generation and balance sheets built to handle choppy conditions.
Rithm Capital now trades at a steep discount to analyst targets and implied fair value, even after the recent bounce. Is that a genuine opportunity, or is the market flagging real risks that the headline earnings do not fully capture?
Most Popular Narrative: 27% Undervalued
Rithm Capital closed at $9.31, while the most widely followed narrative sets fair value at $12.75. The debate is whether the current discount properly reflects execution risk or simply investor caution.
Technology and AI driven cost initiatives across Newrez, including expectations to move cost per loan to roughly 50% below industry averages and to cut servicing cost per loan to $93 with more than $65 million of annual savings after the Valon migration in early 2027, are aimed at expanding net margins and supporting future ROE.
See why 77 investors see Rithm Capital as 27% undervalued.
Result: Fair Value of $12.75 (UNDERVALUED)
Still, the narrative around Rithm Capital can break if higher funding costs squeeze returns on new debt or if weaker mortgage activity keeps origination income under pressure.
Find out about the key risks to this Rithm Capital narrative.
Another View: Rithm Capital Through A P/E Lens
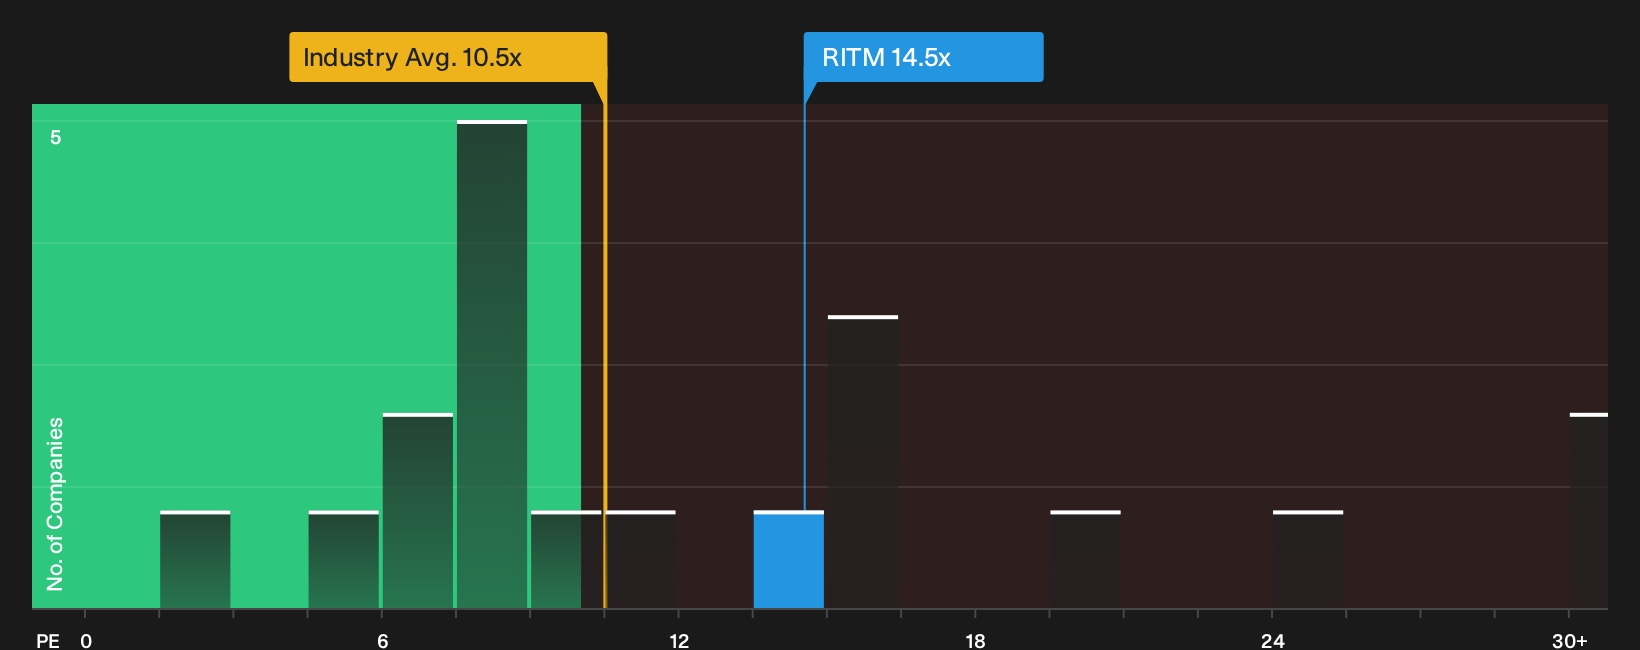
The SWS DCF model points to Rithm Capital trading below an estimated future cash flow value of $37.51, yet the plain P/E picture points in a different direction. At 14.5x earnings versus roughly 10.5x to 10.7x for mortgage REIT peers, the stock screens as expensive on current profits.
The SWS fair ratio for Rithm Capital sits at 20.9x, well above today’s P/E. That gap suggests either earnings quality and growth forecasts eventually justify a richer multiple, or the DCF inputs prove too generous and the share price stays closer to peer levels. Which side of that trade off do you think is more realistic?
See what the numbers say about this price, then decide how comfortable you are with the gap between current and fair ratios with See what the numbers say about this price — find out in our valuation breakdown.
Next Steps
Mixed signals around Rithm Capital can easily pull you in opposite directions, so move quickly. Review the data for yourself and weigh up your own stance using 3 key rewards and 3 important warning signs
Looking for more investment ideas beyond Rithm Capital?
If Rithm Capital has your attention but you want broader context, treat this as a starting point and line up a few fresh watchlist candidates.
- Target steady cash generators and resilient balance sheets by reviewing the list of solid balance sheet and fundamentals (24 results) to help anchor a diversified portfolio.
- Hunt for mispriced opportunities by scanning the 33 high quality undervalued stocks to find companies that combine stronger fundamentals with valuations that still look compressed.
- Balance risk and reward by focusing on stability first and using the 29 resilient stocks with low risk scores to filter for businesses with more resilient profiles.
Have feedback on this article? Concerned about the content? Get in touch with us directly. Alternatively, email editorial-team@simplywallst.com