


Is SMS (TSE:2175) Expensive As Its Board Weighs A Company Split?
SMS (TSE:2175) has drawn fresh interest after its board met on 21 October 2026 to review a proposed company split. The meeting covered the purpose, structure, allocation mechanics, and expected post split profile.
Recent moves in SMS reflect this boardroom rethink. The share price is at ¥2,588 after a 1-day share price return of 3.15% and a 90-day share price return of 17.26%, while the year-to-date share price return of 91.70% and 1-year total shareholder return of 97.91% point to strong momentum despite a softer 3-year and 5-year total shareholder return profile.
Review how SMS compares with other restructuring and turnaround stories by exploring a hand picked set of 71 high quality undiscovered gems that combine business change with strong fundamentals.
Bulls point to SMS’s strong recent share returns and growth in both revenue and net income. Bears, meanwhile, worry about the loss-making bottom line and the upcoming company split. Which side does the current valuation appear to favor?
Price-to-Sales of 3.2x: Is it justified for SMS?
On the numbers provided, SMS trades on a P/S ratio of 3.2x against a last close of ¥2,588, which screens as expensive versus both its professional services peers and the wider industry.
The P/S multiple compares the company’s market value with its annual revenue and is often used where earnings are volatile or loss making. For SMS, which reports revenue of ¥66,275 and a loss making bottom line, this lens focuses attention on how much investors are paying for each unit of sales rather than profits.
Analyst data indicates the JP Professional Services industry trades around 0.9x P/S, while SMS sits at 3.2x. That is a much richer tag for the stock. At the same time, Simply Wall St’s fair P/S estimate is 4.4x, which suggests the current 3.2x level could still be below where the market might eventually settle if those implied fundamentals and growth forecasts play out.
Explore the SWS fair ratio for SMS.
Result: Price-to-sales of 3.2x (OVERVALUED)
Still, the loss of ¥14,529 in net income and the planned company split mean SMS faces real execution risk if sentiment toward restructuring cools.
Find out about the key risks to this SMS narrative.
Another view on SMS using our DCF model
While the P/S ratio suggests SMS screens as expensive against industry peers, the SWS DCF model points in a different direction. On that measure, the shares at ¥2,588 trade about 9.8% below an estimated future cash flow value of ¥2,868.23. Which signal do you treat as the anchor?
Look into how the SWS DCF model arrives at its fair value.
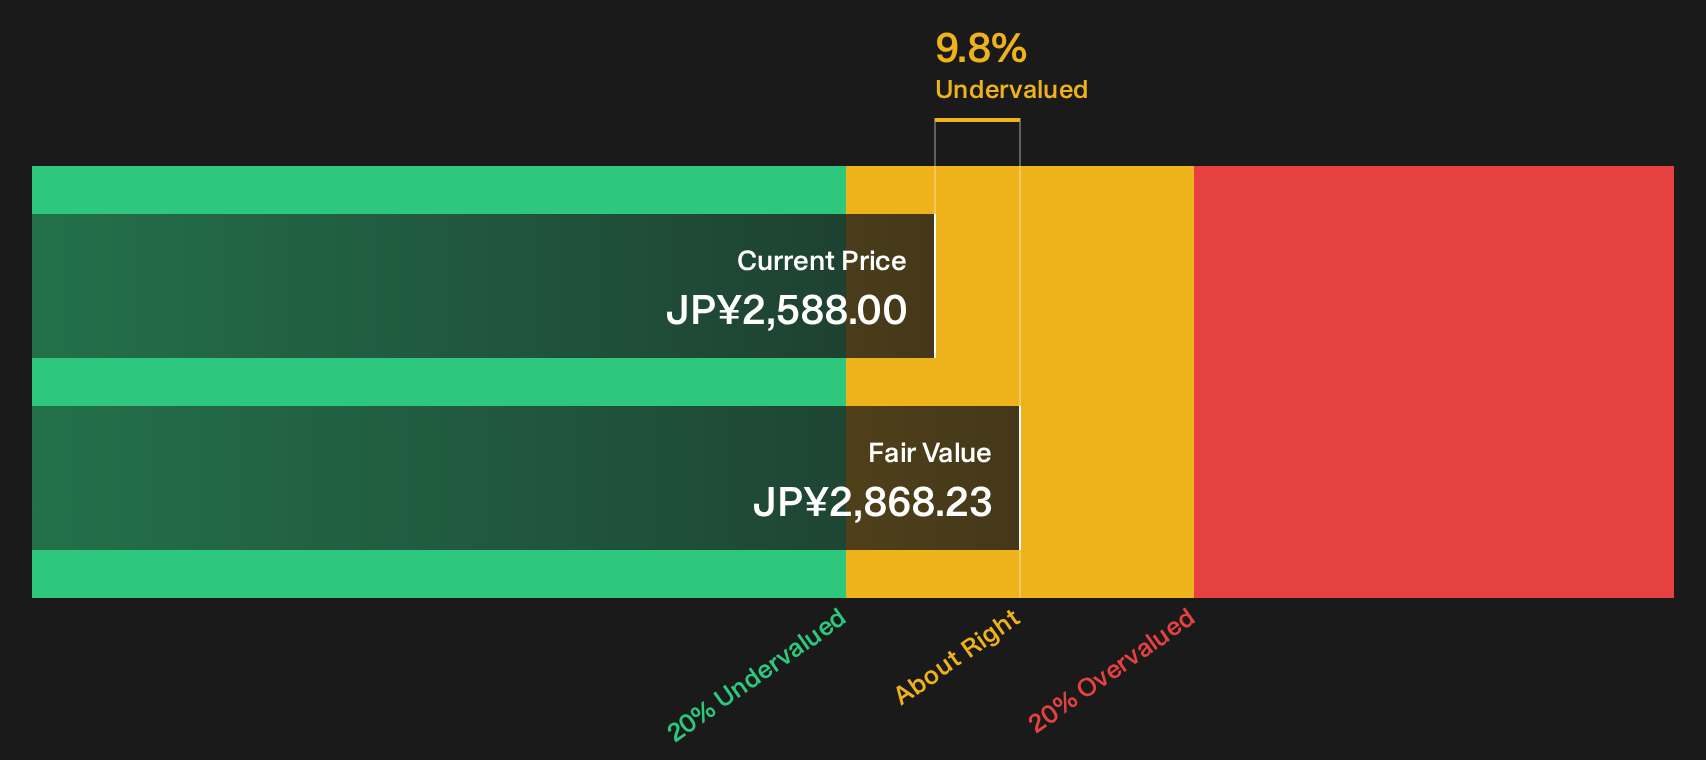
Simply Wall St performs a discounted cash flow (DCF) on every stock in the world every day (check out SMS for example). We show the entire calculation in full. You can track the result in your watchlist or portfolio and be alerted when this changes, or use our stock screener to discover 15 high quality undervalued stocks. If you save a screener we even alert you when new companies match - so you never miss a potential opportunity.
Next Steps
Mixed messages in the SMS story so far. If you care about forming your own view, act quickly and stress test the positives and risks through the 2 key rewards
Looking for more SMS investment ideas?
If SMS has you thinking more broadly about where to put fresh capital to work, do not stop at a single ticker. Broaden your opportunity set with focused stock lists that surface specific strengths, clear financial traits, and different types of potential.
- Target resilient balance sheets and consistent fundamentals by scanning a list of solid balance sheet and fundamentals (22 results) that filters for financial strength before excitement.
- Zero in on pricing opportunities by reviewing a curated pool of 15 high quality undervalued stocks that combine quality metrics with more modest market expectations.
- Prioritize income today by checking a focused group of 27 dividend fortresses that offer elevated yields while still tying back to business fundamentals.
Have feedback on this article? Concerned about the content? Get in touch with us directly. Alternatively, email editorial-team@simplywallst.com