


Franklin Templeton (BEN) Could Be 11% Undervalued After New ETF And China Partnership Moves
Franklin Templeton (BEN) is expanding its presence in digital assets by launching two Nasdaq-listed ETFs that pair U.S. equities with Bitcoin exposure through a rules-based dividend reinvestment approach, keeping Bitcoin as a secondary holding.
Against this product push, Franklin Templeton’s share price has retreated 6.56% over the past 90 days but still shows a 32.94% year-to-date share price return, while total shareholder return sits at 46.86% over one year and 52.96% over three years, indicating that recent digital asset ETFs and the new China Asset Management partnership are being weighed against earlier gains as investors reassess both growth potential and risk.
Scan beyond Franklin Templeton and line up asset managers pushing into digital assets with a curated list of 18 high quality undiscovered gems.
Franklin Templeton now trades well below its recent highs, even as it rolls out new digital asset products and partnerships. Is that pullback mainly about the underlying business or a swing in sentiment, and what does current pricing suggest?
Most Popular Narrative: 10.9% Undervalued
Franklin Templeton last closed at $31.64, while the most followed narrative pegs fair value at $35.50. The current pullback is therefore being evaluated against a view that the shares trade at a discount based on long term fee and earnings potential under a discount rate of 8.28%.
The push into private assets and alternatives is moving ahead, with alternative AUM of about 294b and fiscal 2026 private markets fundraising now expected to reach around 40b. With roughly 80% of private markets AUM generating fees at an average base rate of about 65 bps, this strategy directly targets higher fee revenue and a richer mix of earnings over time.
See why 18 investors see Franklin Templeton as 11% undervalued.
Result: Fair Value of $35.50 (UNDERVALUED)
Still, if fee pressure from large distributors keeps the effective rate near the high 30 bps range or if integration issues hit performance, the Franklin Templeton thesis weakens.
Find out about the key risks to this Franklin Templeton narrative.
Another View: Franklin Templeton Through Earnings Ratios
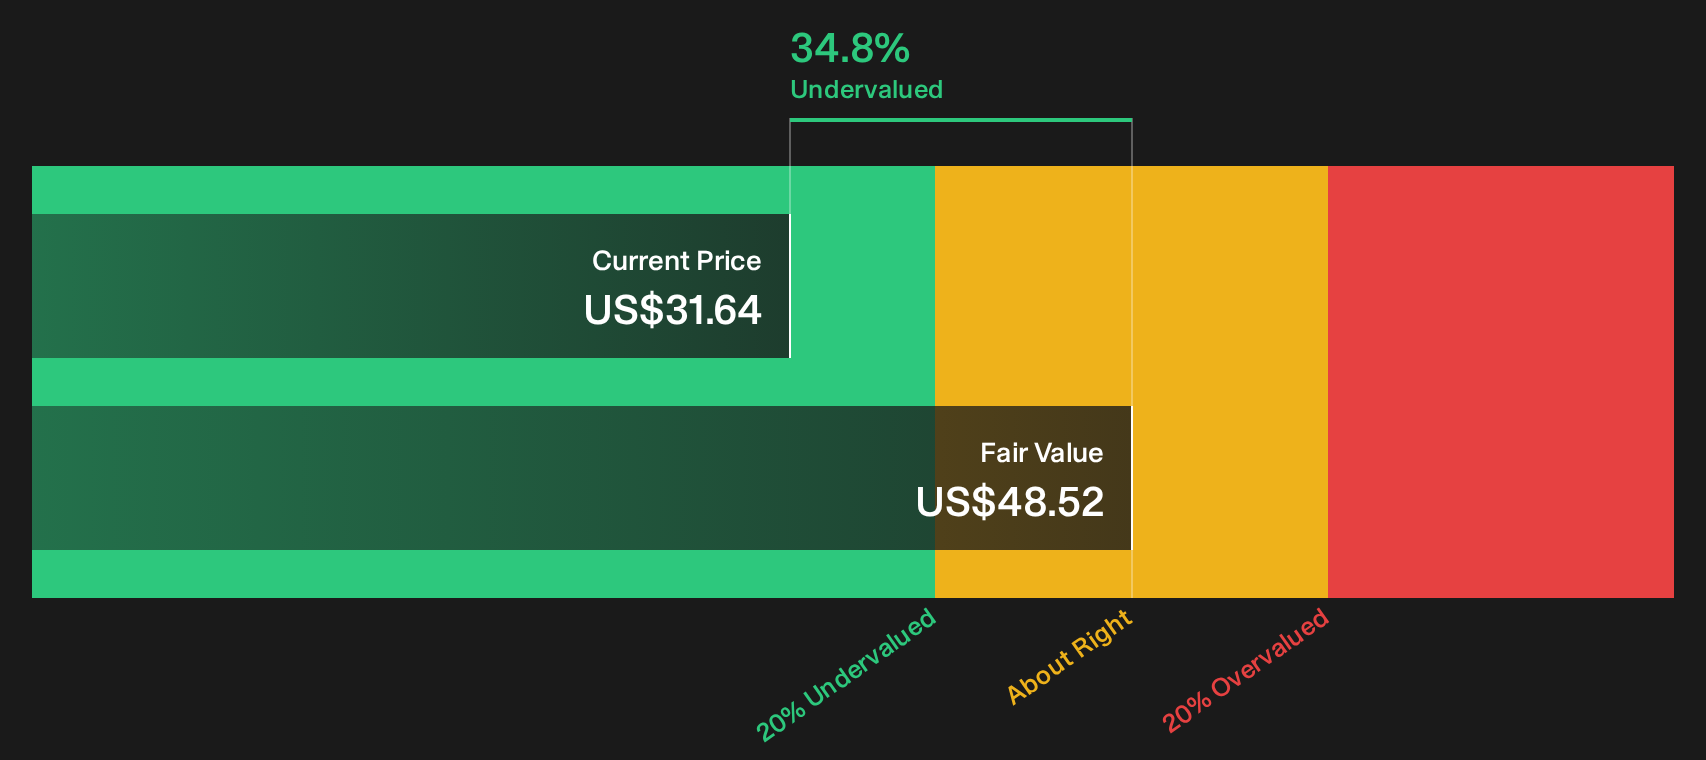
The DCF lens suggests that Franklin Templeton is trading about 34.8% below an estimated fair value of $48.52, which points to an undervalued stock. Yet the P/E of 21.2x is well above a fair ratio of 13.2x, raising the question of whether cash flow or earnings risk should matter more for you.
For anyone weighing those two signals side by side, it helps to see how the SWS DCF model is built and stress tested under different assumptions. Look into how the SWS DCF model arrives at its fair value.
Next Steps
Mixed signals around Franklin Templeton’s value and risk profile are clear, so move quickly and test those assumptions against the data yourself. To weigh both sides of that debate in one place, start with the 3 key rewards and 2 important warning signs.
Looking for more investment ideas beyond Franklin Templeton?
If Franklin Templeton has your attention, do not stop there. Broaden your watchlist now, or you risk missing other opportunities that fit your style.
- Target stronger balance sheets by scanning a list of solid balance sheet and fundamentals (25 results) that focuses on financial resilience and fundamental strength.
- Hunt for mispriced opportunities using a curated 29 high quality undervalued stocks designed to surface quality businesses at discounted market prices.
- Prioritize income potential by reviewing a focused 5 dividend fortresses that highlights higher yielding payers with an emphasis on staying power.
Have feedback on this article? Concerned about the content? Get in touch with us directly. Alternatively, email editorial-team@simplywallst.com