


Lucid (LCID) Stock Looks Stretched Against Its Current Sales Base
Lucid Group has gone from a high-profile electric vehicle hopeful to a stock that has seen heavy value erosion, which raises a blunt question for anyone looking at the ticker today. Is the current share price meaningfully supported by the level of sales the business is generating, or is the market paying for something that is not yet visible in the revenue line?
- Over the past 5 years the stock has fallen 99.1%, which puts the focus squarely on whether the remaining equity value is now closely aligned with the scale of Lucid Group's sales.
- With an early stage manufacturing footprint and sizeable capital needs for production and charging infrastructure, future sales growth and pricing power can be critical to how much revenue investors are effectively paying for at today's valuation.
- The analysts covering Lucid Group have run their own numbers. See what analysts think Lucid Group's shares could be worth.
The issue now is whether the current Lucid Group share price is appropriately anchored to its sales once you compare it with the Fair Ratio benchmark.
If you are testing whether Lucid Group’s valuation aligns with its sales and want a few comparison points, it can help to run the same lens across 29 high quality undervalued stocks
Has Lucid Group Run Too Far on Sales?
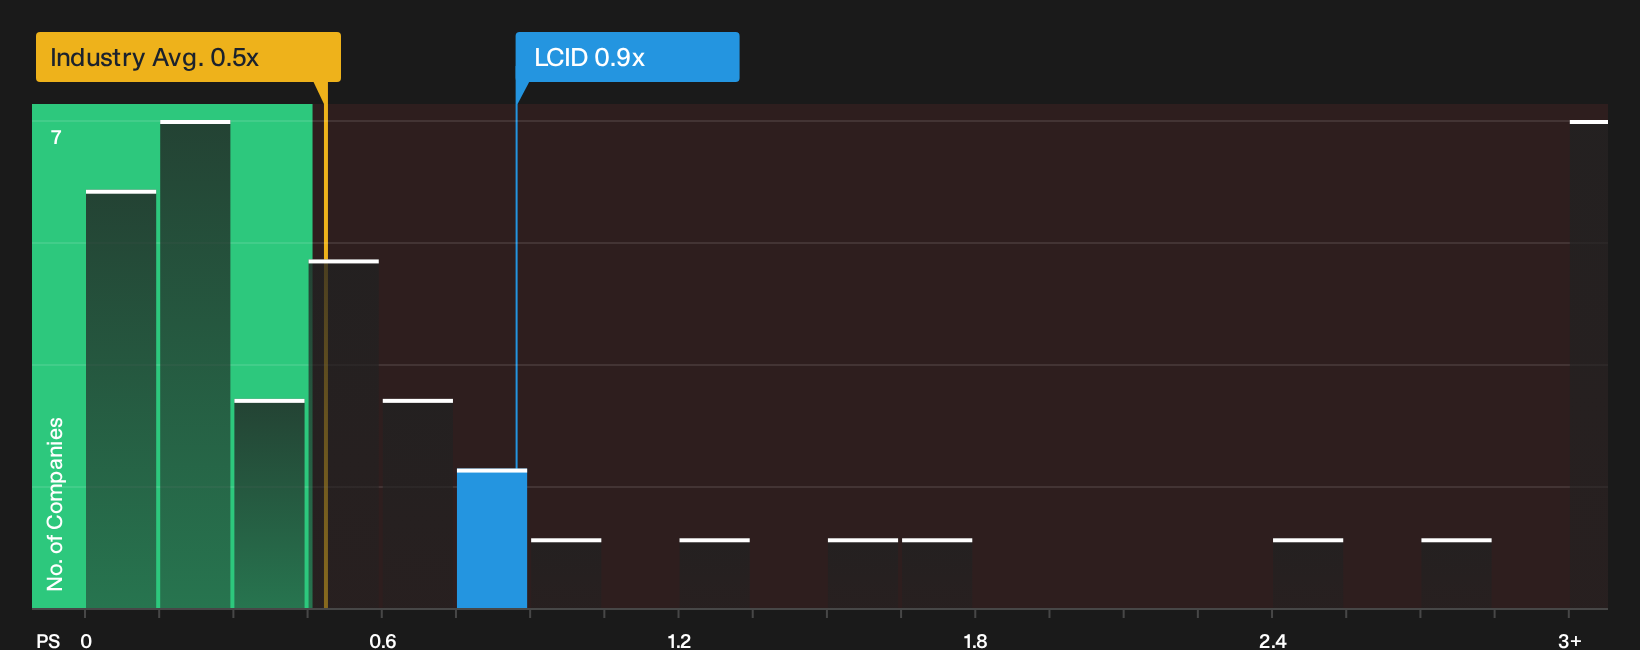
P/S is a useful lens for Lucid Group because earnings are still negative and the conversation is really about how much investors are paying for each dollar of revenue. On this yardstick, the stock trades on a P/S of 0.9x, compared with an auto industry average of about 0.5x and a peer group closer to 0.3x. That represents a clear premium to both the wider sector and more immediate comparables.
The Fair Ratio model, which adjusts the P/S multiple for Lucid Group’s growth profile, margins, size and risk, points to a materially lower figure than where the shares trade today. The large difference suggests the framework is heavily factoring in ongoing losses and execution risk, so the outcome reads less like a precise target and more like a warning flag that the stock currently screens as overvalued on this metric. Explore the numbers behind Lucid Group's P/S valuation.
The Lucid Group Narrative: What Would Justify Today's Price?
Simply Wall St Narratives picks up where the Lucid Group valuation puzzle leaves off by spelling out which combinations of future growth, margins and earnings would need to occur for the stock to be worth materially more or less than today’s price on the Community page. Each narrative links a potential fair value to a specific set of catalysts and risks for Lucid Group, so you can track over time which version of events appears to be taking shape.
Lucid Group splits the community, with one camp leaning into new partnerships and platforms while the other zeroes in on cash burn and execution strain.
Bull case: 55% undervalued
"The upcoming launch of Lucid's midsized EV platform in late 2026 targets a much broader customer base with lower-cost, high-volume vehicles..."
Discover why this Narrative puts Lucid Group at 55% undervalued.
Bear case: 14% overvalued
"The recall of 27,185 Lucid Air sedans in the U.S. for a potential fire risk, which exceeds the company’s total 2025 sales, introduces reputational risk..."
Explore why this Narrative puts Lucid Group at 14% overvalued.
Lucid Group’s valuation still leaves one crucial angle unexplored
The numbers on Lucid Group only tell part of the story, because our broader review has also flagged specific pressure points inside the business that investors may want to weigh carefully. Take a closer look at 3 warning signs (1 major) before settling on a valuation.
Have feedback on this article? Concerned about the content? Get in touch with us directly. Alternatively, email editorial-team@simplywallst.com