


Hulic Reit (TSE:3295) Following Full Year Results Looks Caught Between Value Signals
Hulic Reit (TSE:3295) just released full year results for the period ended August 31, 2026, reporting sales of ¥21,414.55 million, revenue of ¥24,932.33 million, and net income of ¥11,813.89 million.
The earnings release comes after a tougher stretch for Hulic Reit’s units, with the share price at ¥138,700 and a 30 day share price return down 5.77%, while the 1 year total shareholder return has declined 14.16% but remains slightly positive over three years.
Scan Hulic Reit alongside a curated 22 resilient stocks with low risk scores that investors use when they want defensiveness to matter as much as return potential.
Hulic Reit units now trade at a steep discount to both analyst targets and some intrinsic value estimates after this earnings release. Is that markdown a signal of excessive caution, or a fair price for the risk on offer?
Preferred P/E of 16.9x: Is it justified for Hulic Reit?
Hulic Reit trades on a P/E of 16.9x, which is very slightly higher than the peer average of 16.7x and above the Asian REITs group on 14.6x, even after the recent unit price pullback to ¥138,700.
The P/E ratio compares the current unit price with earnings per unit and is a common way investors weigh how much they are paying for each unit of profit in a real estate investment trust. It is especially useful for Hulic Reit because earnings and distributions are key anchors for how many investors assess listed property trusts.
On one hand, the units look expensive compared with both direct peers and the broader Asian REITs basket. On the other hand, the estimated fair P/E of 19.6x is well above the current 16.9x. This suggests the market could eventually shift closer to that level if investors place more weight on Hulic Reit’s earnings quality, high and reliable 5.77% dividend, and long term earnings track record.
The gap to industry and peer averages is clear. Hulic Reit trades on a richer multiple than both its immediate comparison group at 16.7x and the wider Asian REITs industry on 14.6x. Yet it screens as good value when set against the 19.6x fair ratio estimate.
Explore the SWS fair ratio for Hulic Reit.
Result: Price-to-Earnings of 16.9x (ABOUT RIGHT)
Still, Hulic Reit faces pressure from its declining 1 year and year to date total returns, and any weakening in office or retail demand could quickly become significant.
Find out about the key risks to this Hulic Reit narrative.
Another View: Hulic Reit Through a Cash Flow Lens
The earnings multiple paints Hulic Reit as only slightly cheap. A different picture appears when using the SWS DCF model, which estimates fair value at ¥329,616 per unit versus a market price of ¥138,700. That gap frames Hulic Reit as heavily undervalued on cash flows. Is the market mispricing the long term cash generation, or are the assumptions too generous?
Look into how the SWS DCF model arrives at its fair value.
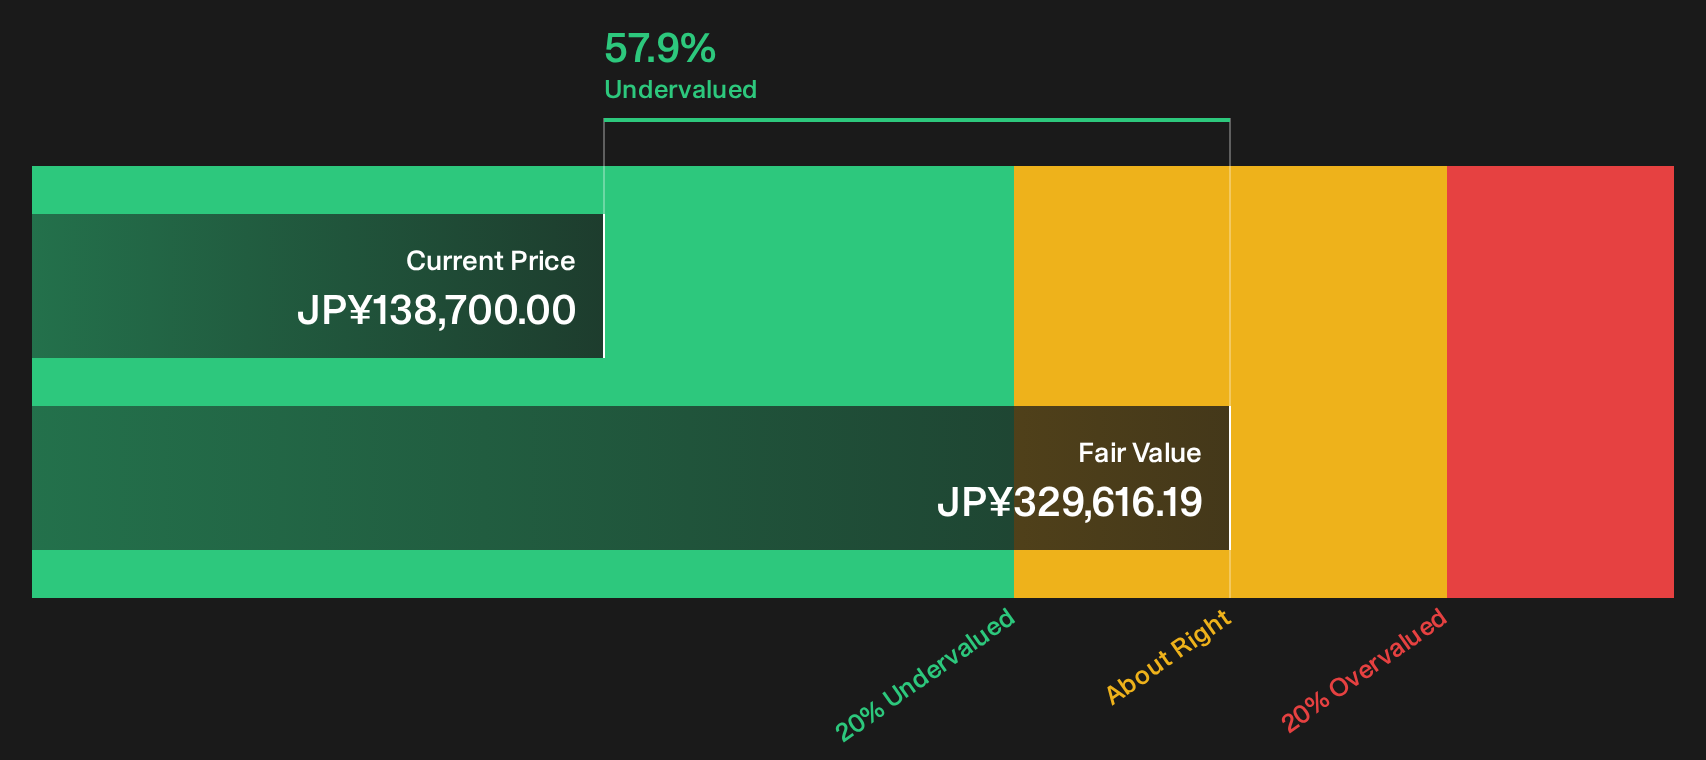
Simply Wall St performs a discounted cash flow (DCF) on every stock in the world every day (check out Hulic Reit for example). We show the entire calculation in full. You can track the result in your watchlist or portfolio and be alerted when this changes, or use our stock screener to discover 14 high quality undervalued stocks. If you save a screener we even alert you when new companies match - so you never miss a potential opportunity.
Next Steps
Mixed messages in Hulic Reit's valuation story are clear, and the numbers cut both ways. Act promptly, review the data yourself, and weigh the balance of 3 key rewards and 1 important warning sign
Looking for more Hulic Reit sized investment ideas?
Do not stop with Hulic Reit. A few minutes with a focused screener can reveal opportunities you would never spot from headlines or price charts alone.
- Target resilient performers that combine staying power with measured upside by scanning a 22 resilient stocks with low risk scores built to prioritise durability alongside return potential.
- Hunt for mispriced opportunities where quality and valuation line up by using a 72 high quality undiscovered gems that filters for strong fundamentals others may be overlooking.
- Stack your watchlist with steady cash generators by leaning on a 29 dividend fortresses focused on income streams that can support long term compounding.
Have feedback on this article? Concerned about the content? Get in touch with us directly. Alternatively, email editorial-team@simplywallst.com