


Glory (TSE:6457), What Is Behind The Fresh Attention?
Glory (TSE:6457) continues to attract attention after a recent move in its share price, prompting investors to reassess the business, its recent returns, and how the current valuation lines up with fundamentals.
Glory's share price has eased 0.95% over the past day to ¥5,102, after a strong 30-day share price return of 12.03% and a year-to-date share price gain of 26.38%. That shorter term momentum lines up with a 1-year total shareholder return of 41.27% and a 5-year total shareholder return of 146.14%, which indicates that sentiment has strengthened over time rather than faded.
Scan momentum stories like Glory's alongside other hand-picked industrials and capital goods opportunities in our list of solid balance sheet and fundamentals (23 results)
Bulls point to Glory’s recent share price run and improving net income, while bears flag the gap to analyst targets and lingering doubts on value. Which side does the current valuation actually support?
Price-to-Earnings of 15.6x: Is it justified?
On a simple snapshot, Glory trades on a P/E of 15.6x, which looks full when set against both its peers and the industry average.
The P/E ratio compares the current share price to earnings per share. For a manufacturer of cash handling systems with consistent profitability, it gives you a quick read on how much the market is paying for each unit of current earnings.
That 15.6x multiple sits above the JP Machinery industry average of 12.4x and above the peer group average of 13.5x. It also exceeds an estimated fair P/E of 13.9x. This indicates that investors are paying a richer price than the level the market could move towards if sentiment cools or earnings do not keep pace.
Explore the SWS fair ratio for Glory.
Result: Price-to-Earnings of 15.6x (OVERVALUED)
Still, the share price trading above the ¥4,570 analyst target and an intrinsic value discount of 19.94% both leave Glory exposed if market sentiment weakens.
Find out about the key risks to this Glory narrative.
Another View: What The DCF Says About Glory
The P/E work points to a rich tag for Glory, yet the SWS DCF model sends a different message. At ¥5,102, the shares trade about 19.9% below an estimated future cash flow value of roughly ¥6,372. That suggests cash flow expectations paint a more generous picture of value. Which lens do you trust more when those signals clash?
Look into how the SWS DCF model arrives at its fair value.
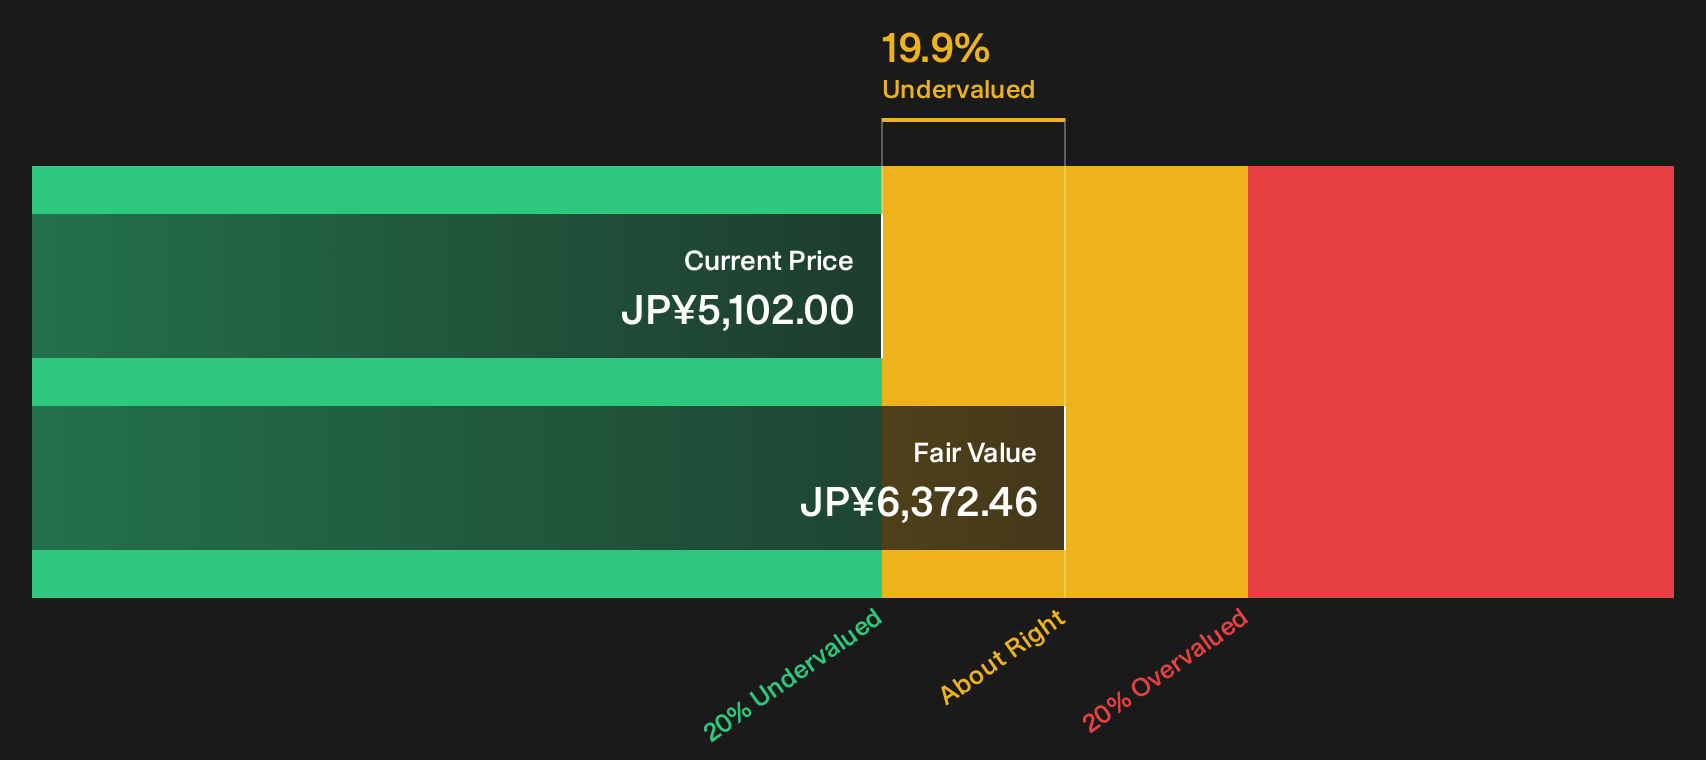
Simply Wall St performs a discounted cash flow (DCF) on every stock in the world every day (check out Glory for example). We show the entire calculation in full. You can track the result in your watchlist or portfolio and be alerted when this changes, or use our stock screener to discover 14 high quality undervalued stocks. If you save a screener we even alert you when new companies match - so you never miss a potential opportunity.
Next Steps
Mixed signals on Glory's valuation and risk profile can pull you in different directions, so consider acting promptly, review the underlying data, and decide where you stand by weighing its 3 key rewards and 1 important warning sign
Looking for more investment ideas beyond Glory?
Do not stop your research with Glory. Broaden your watchlist using focused screeners that surface clear, data backed ideas aligned with how you like to invest.
- Target potential mispricings and look for quality at a discount with a curated set of 14 high quality undervalued stocks.
- Prioritise resilience and seek to protect your downside by reviewing 22 resilient stocks with low risk scores that score well on stability.
- Aim for reliable income and stress test your yield choices against our hand picked 29 dividend fortresses.
Have feedback on this article? Concerned about the content? Get in touch with us directly. Alternatively, email editorial-team@simplywallst.com