


Flagstar Bank National Association (FLG) Misses Q3 Expectations, Is It Still Cheap?
Flagstar Bank National Association (FLG) is back under the microscope after Q3 2026 results missed Wall Street expectations, with basic earnings per share stuck at US$0.01 and profitability targets pushed out to 2028.
The Q3 miss has hit Flagstar Bank National Association’s momentum hard, with the 1-day share price return down 9.27% on the earnings reaction and the 30-day share price return down 16.22% as investors reassess credit risk and the longer turnaround. At US$10.38, the stock now shows a 1-year total shareholder return decline of 14.03% and a 3-year total shareholder return drop of 61.22%. This signals fading confidence in the recovery story despite management’s push to restructure the loan book and extend the profitability timeline to 2028.
Pressure test Flagstar Bank National Association against a curated 30 resilient stocks with low risk scores that focuses on balance sheet strength when credit costs and turnaround timelines become the key story.
Bulls point to Flagstar Bank National Association’s balance sheet pivot and long runway to 2028, while bears focus on thin earnings and a 68.4x P/E after the drop. Which story does the current valuation support?
Most Popular Narrative: 31% Undervalued
Flagstar Bank National Association’s most followed narrative pegs fair value at $15.06 versus the latest close of $10.38. This spread leaves a sizable valuation gap for investors to examine, especially in light of the recent earnings stumble and delayed profitability goals.
Flagstar is deliberately rotating out of low coupon multifamily and CRE into higher yielding C&I and new, geographically diversified CRE while also paying down nearly $20 billion of high cost wholesale funding and lowering deposit costs. The combined effect of mix shift and cheaper liabilities could structurally widen net interest margin far more than implied by a flat share price outlook.
See why 7 investors see Flagstar Bank National Association as 31% undervalued.
Result: Fair Value of $15.06 (UNDERVALUED)
Still, two pressure points could change the Flagstar Bank National Association story quickly: higher net charge offs and slower than expected progress on shrinking nonaccrual loans.
Find out about the key risks to this Flagstar Bank National Association narrative.
Another View: Flagstar Bank National Association Looks Expensive On Earnings
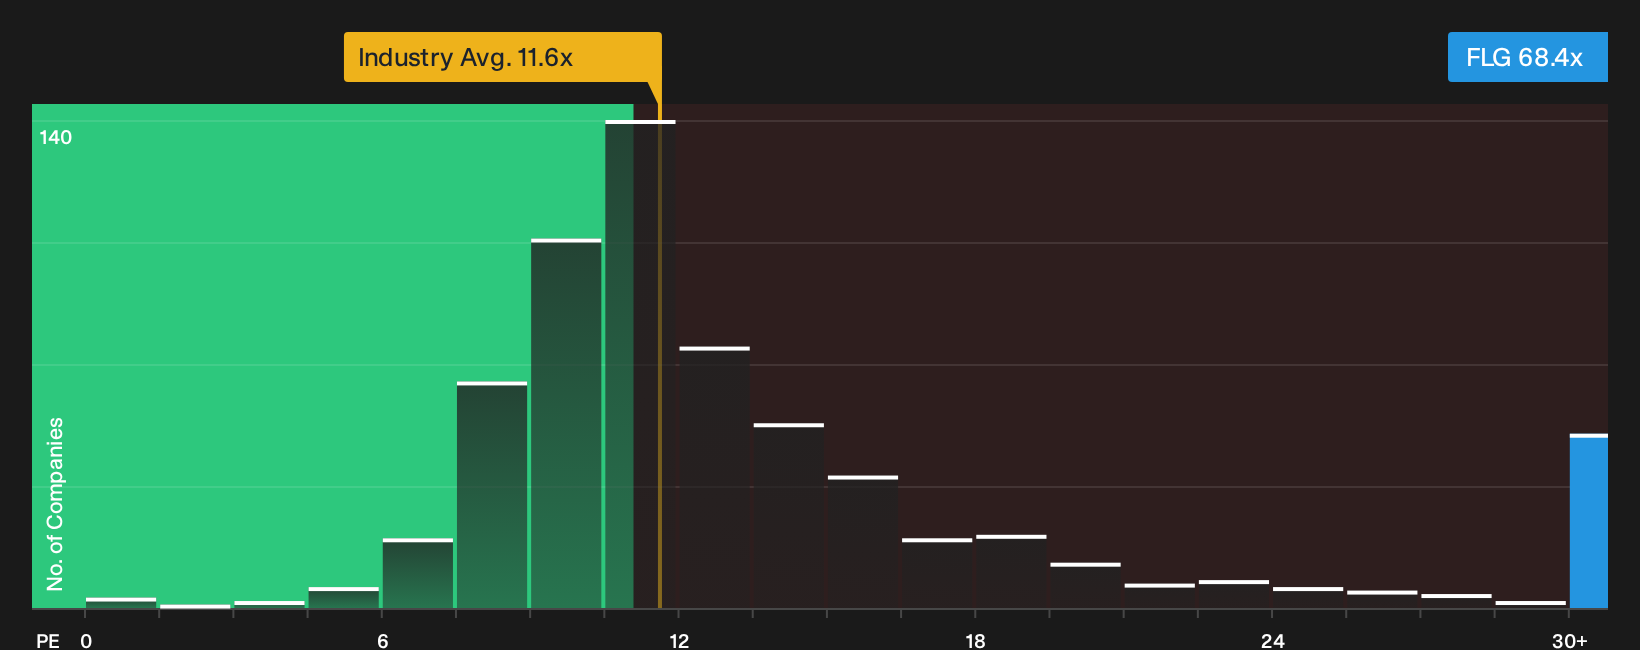
The fair value narrative around $15.06 leans on long term forecasts. A simple P/E check paints a tougher picture. Flagstar Bank National Association trades on 68.4x earnings, compared with 11.6x for US banks, 19x for peers, and a fair ratio of 47.4x. That gap points to real valuation risk if sentiment cools.
To see what the numbers say about this price in more depth, review the See what the numbers say about this price — find out in our valuation breakdown. and compare how Flagstar Bank National Association stacks up against other financial stocks.
Next Steps
Does the mixed tone around Flagstar Bank National Association leave you cautious or curious about the risk reward trade off here? Act while the information is fresh and pressure test the story yourself by weighing its 3 key rewards and 2 important warning signs.
Looking for more investment ideas beyond Flagstar Bank National Association?
If Flagstar Bank National Association feels finely balanced on risk and reward, broadening your opportunity set now can sharpen your decisions and reduce single stock concentration.
- Target potential mispricings by scanning companies with strong fundamentals using the 29 high quality undervalued stocks that screens for quality at a compressed price tag.
- Strengthen your income stream by focusing on reliable payouts through the 5 dividend fortresses that filters for higher yielding businesses.
- Protect your downside by concentrating on financially sound businesses with the list of solid balance sheet and fundamentals (24 results) that highlights balance sheets built to handle stress.
Have feedback on this article? Concerned about the content? Get in touch with us directly. Alternatively, email editorial-team@simplywallst.com