


National Beverage (FIZZ) Rebound Puts Its Valuation Back In Focus
Recent trading in National Beverage (FIZZ) has pushed the stock to a last close of $34.96. This leaves investors weighing how its current valuation lines up with reported revenue of $1.18b and net income of $174.89m.
Momentum around National Beverage has picked up recently, with a 1-day share price return of 1.89% adding to a 7-day move of 14.55% and a 90-day share price gain of 12.23%. That short-term strength contrasts with a 3-year total shareholder return that is down 6.09%, signalling that recent optimism is emerging after a weaker, longer stretch.
Scan momentum moves like National Beverage’s and compare them with a hand-picked set of 20 high quality undiscovered gems that pair recent share price strength with underlying fundamental support.
After a sharp short-term rebound but a weaker multi-year track record, National Beverage now asks a simple question of buyers: Does the current price still offer a compelling trade-off between upside and risk?
Price-to-Earnings of 18.7x: Is it justified?
On current numbers, National Beverage trades on a P/E of 18.7x, which lines up with a $34.96 share price that the broader market is treating as relatively full compared with several benchmarks.
The P/E ratio compares what investors are paying today for each dollar of earnings. For a beverage producer with $1.18b in revenue and $174.89m in net income, this measure goes straight to how confidently the market is pricing those profits.
For National Beverage, that confidence carries a cost. The stock is described as expensive against the Global Beverage sector average of 16.9x, while also screening as rich versus an estimated fair P/E of 14.3x. That fair level is a reference point the market could move towards if sentiment cools or earnings do not keep pace with expectations.
Set against peers though, the picture shifts. The same 18.7x multiple is framed as good value relative to a peer group average of 57.6x. This represents a very large gap. Investors are paying more than both the industry and fair ratio markers imply. However, they are paying far less than the multiples seen across a narrower peer set.
Explore the SWS fair ratio for National Beverage.
Result: Preferred multiple of price-to-earnings of 18.7x (OVERVALUED).
Still, the recent rebound in National Beverage contrasts with a 5-year total shareholder return that is down 22.69% and a value score of just 2.
Find out about the key risks to this National Beverage narrative.
Another View: What The SWS DCF Model Says
The P/E ratio points to National Beverage looking expensive, yet the SWS DCF model tells a softer story. On that framework, a share price of $34.96 sits about 2.7% below an estimated future cash flow value of $35.95. That labels the stock as modestly undervalued. So which signal carries more weight for you: the earnings multiple or the cash flow math?
For a closer look at how that cash flow view is built out and where the key assumptions sit, Look into how the SWS DCF model arrives at its fair value.
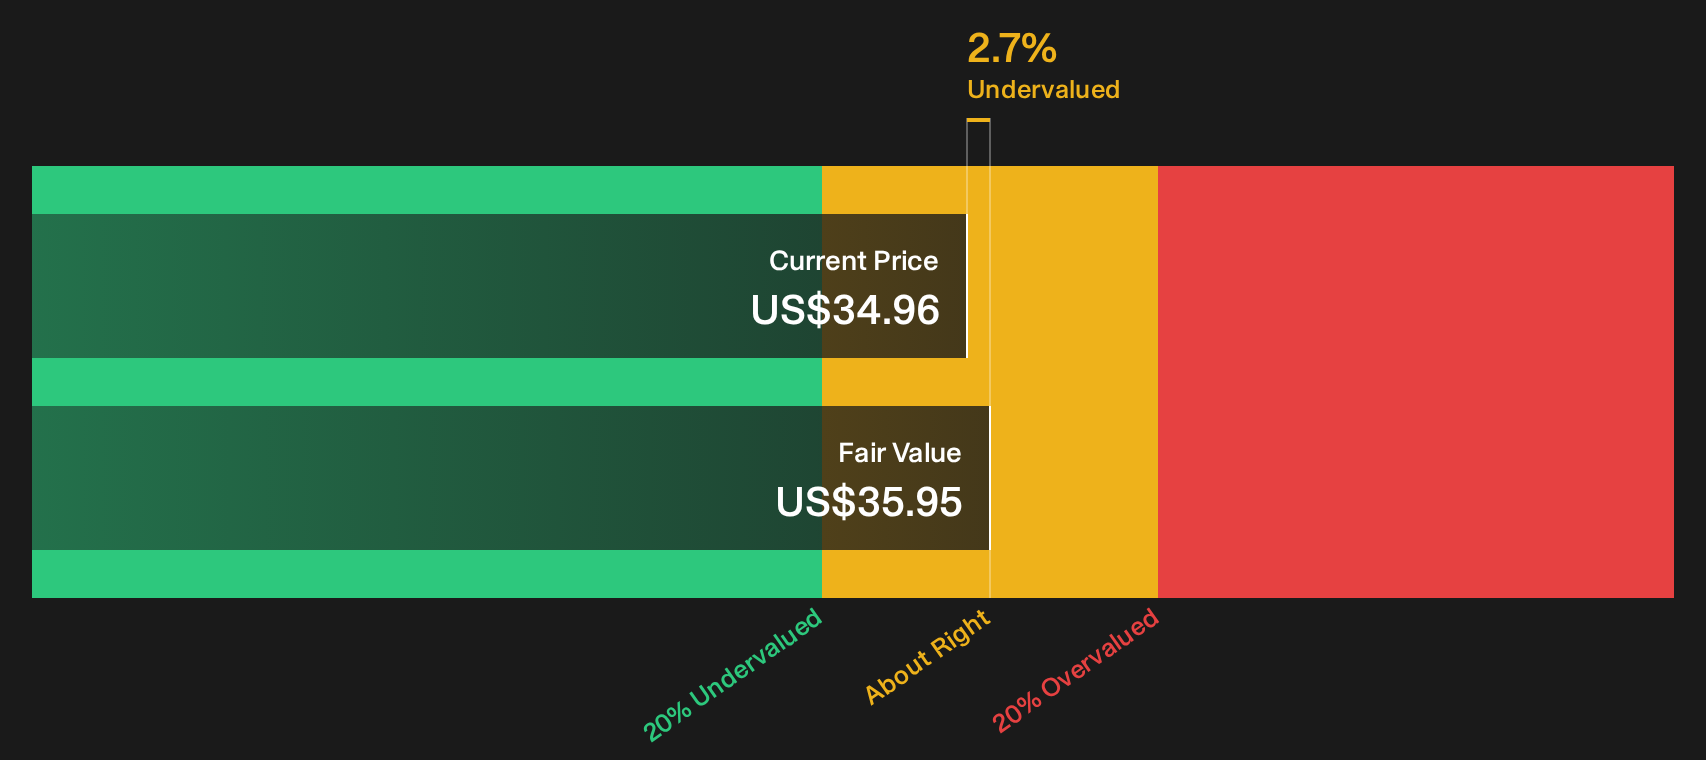
Simply Wall St performs a discounted cash flow (DCF) on every stock in the world every day (check out National Beverage for example). We show the entire calculation in full. You can track the result in your watchlist or portfolio and be alerted when this changes, or use our stock screener to discover 33 high quality undervalued stocks. If you save a screener we even alert you when new companies match - so you never miss a potential opportunity.
Next Steps
If the mixed signals around National Beverage leave you unsure, treat that hesitation as a cue to inspect the details yourself and make a prompt decision. Then weigh those findings against the 2 key rewards
Looking for more National Beverage investment ideas?
If National Beverage has your attention, do not stop here. Broaden your watchlist with a few focused stock shortlists that sharpen your next move.
- Target stronger value by reviewing companies that pair solid fundamentals with appealing prices through the 33 high quality undervalued stocks.
- Prioritize resilience and capital protection by checking stocks that score well on risk metrics via the 32 resilient stocks with low risk scores.
- Strengthen your quality bias by scanning businesses with robust balance sheets and sound fundamentals using the list of solid balance sheet and fundamentals (25 results).
This article by Simply Wall St is general in nature. We provide commentary based on historical data and analyst forecasts only using an unbiased methodology and our articles are not intended to be financial advice. It does not constitute a recommendation to buy or sell any stock, and does not take account of your objectives, or your financial situation. We aim to bring you long-term focused analysis driven by fundamental data. Note that our analysis may not factor in the latest price-sensitive company announcements or qualitative material. Simply Wall St has no position in any stocks mentioned.
Have feedback on this article? Concerned about the content? Get in touch with us directly. Alternatively, email editorial-team@simplywallst.com