


Travis Perkins (LSE:TPK) Reports Weaker Sales, Is It Still Below Fair Value?
Why Travis Perkins Stock Is Back In Focus
Travis Perkins (LSE:TPK) is under scrutiny after its latest trading update showed group revenue down 1.6% in the third quarter and 1.8% for the year to date, prompting more cautious analyst sentiment.
After a weak trading statement on 15 October 2026, Travis Perkins has seen short term momentum pick up, with an 8.6% 7-day share price return and an 8.9% 90-day share price gain, even though the 5-year total shareholder return is down 54.9%.
Compare Travis Perkins against peers facing similar pressure on trading updates by scanning our hand picked group of 7 high quality undervalued stocks with resilient fundamentals.
The recent bounce in Travis Perkins after a weak trading update puts you at a fork in the road. Is this a decent entry already, or does the valuation still argue for patience?
Most Popular Narrative: 9% Undervalued
The most followed narrative currently places Travis Perkins fair value at £6.55, compared with the latest close at £5.97. This frames the recent rebound as investors reassessing earlier pessimism rather than pricing in a full recovery.
Stabilization and turnaround in the merchanting business, driven by refilled key operational roles, enhanced customer-centricity, and targeted local promotions, are likely to translate into regained market share and higher sales volumes as the UK construction market normalizes, improving future revenue and operating profit.
See why 7 investors see Travis Perkins as 9% undervalued.
Result: Fair Value of £6.55 (UNDERVALUED)
Still, the Travis Perkins narrative can quickly crack if margin pressure lingers or if ongoing digital execution problems continue to push customers toward faster online rivals.
Find out about the key risks to this Travis Perkins narrative.
Another View On Travis Perkins Valuation
There is a big catch in the Travis Perkins story. Our DCF model points to a future cash flow value of £1.81 per share against the current £5.97 price, which reads as overvalued instead of undervalued. Which signal do you trust more in your own process?
Look into how the SWS DCF model arrives at its fair value.
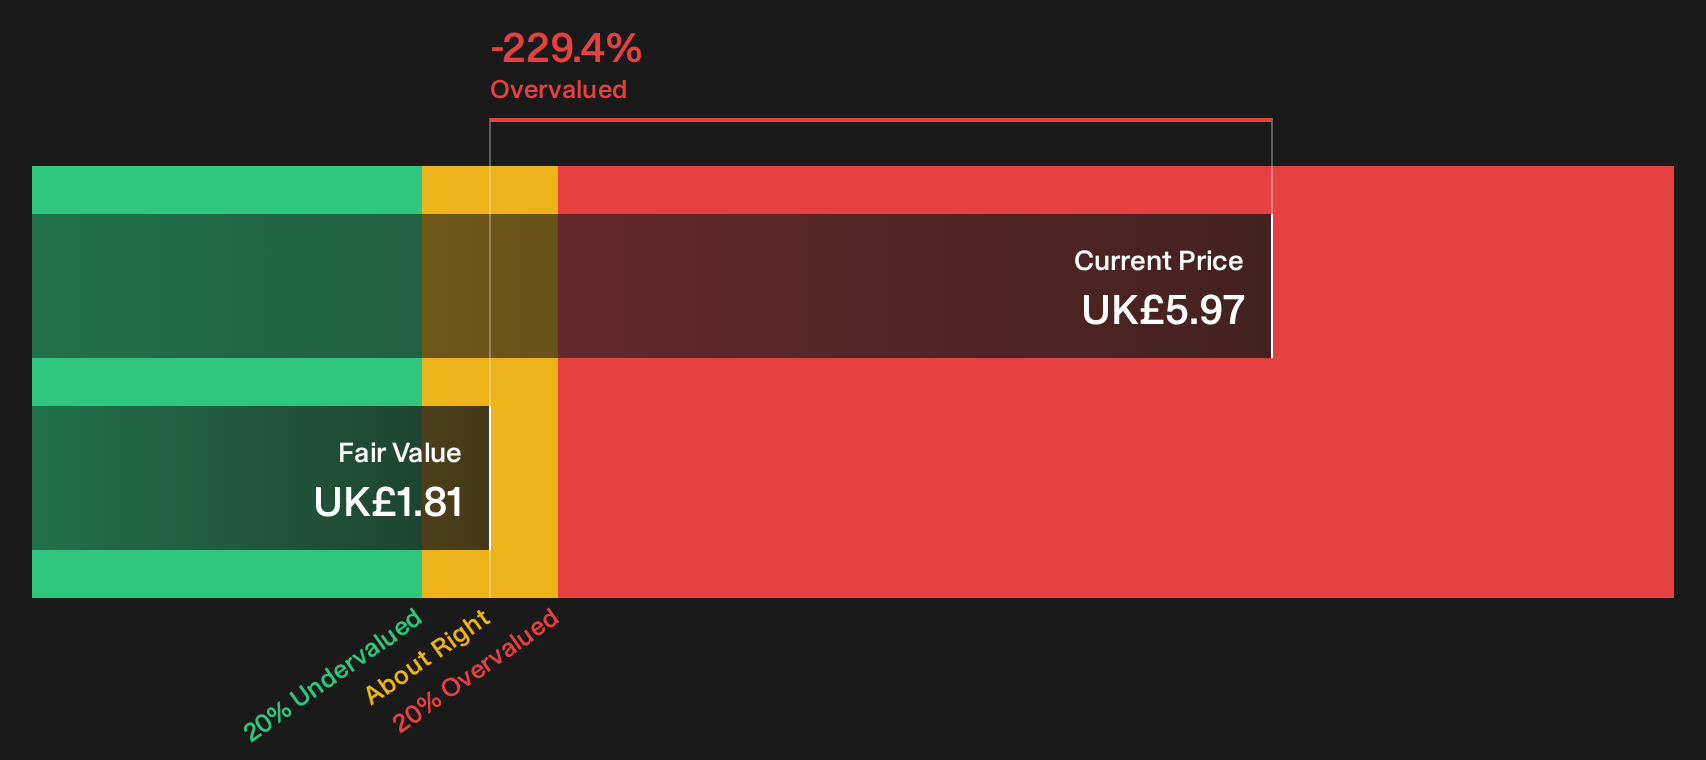
Simply Wall St performs a discounted cash flow (DCF) on every stock in the world every day (check out Travis Perkins for example). We show the entire calculation in full. You can track the result in your watchlist or portfolio and be alerted when this changes, or use our stock screener to discover 7 high quality undervalued stocks. If you save a screener we even alert you when new companies match - so you never miss a potential opportunity.
Next Steps
Mixed views like this around Travis Perkins rarely last for long. Pressure test the numbers yourself and weigh the optimism in the 2 key rewards.
Want More Ideas Beyond Travis Perkins?
If Travis Perkins leaves you on the fence, do not stop here. Broaden your watchlist with tighter filters that match your own risk and income preferences.
- Target robust balance sheets and steadier fundamentals by scanning a curated list of solid balance sheet and fundamentals (9 results) that can help you avoid fragile businesses.
- Hunt for mispriced opportunities by running through a focused set of 7 high quality undervalued stocks that pair quality metrics with discounted valuations.
- Spot potential future favourites early by reviewing a refined pool of 5 high quality undiscovered gems before they attract wider attention.
This article by Simply Wall St is general in nature. We provide commentary based on historical data and analyst forecasts only using an unbiased methodology and our articles are not intended to be financial advice. It does not constitute a recommendation to buy or sell any stock, and does not take account of your objectives, or your financial situation. We aim to bring you long-term focused analysis driven by fundamental data. Note that our analysis may not factor in the latest price-sensitive company announcements or qualitative material. Simply Wall St has no position in any stocks mentioned.
Have feedback on this article? Concerned about the content? Get in touch with us directly. Alternatively, email editorial-team@simplywallst.com