


AF Gruppen (OB:AFG) Could Be 17% Undervalued Following Its NOK 409 Million Oslo Contract
AF Gruppen (OB:AFG) has secured a NOK 409 million design and build contract for Plot D at Campus Diakonhjemmet in Oslo, adding another large mixed use project to its order book.
AF Gruppen shares trade at NOK189.2 after a 1-day share price return of 1.39%, and the contract win fits into a pattern where short-term momentum has been mixed, with the 30-day share price return down 1.77% but the 1-year total shareholder return at 20.26% suggesting that investors have generally been rewarded over a longer horizon.
Scan how AF Gruppen compares to other construction and infrastructure players by reviewing a curated list of list of solid balance sheet and fundamentals (204 results) in similar capital-intensive sectors.
AF Gruppen keeps winning sizeable work and has rewarded patient shareholders, yet the share price already reflects a long run of delivery. The real test now is whether NOK189.2 still leaves enough value on the table.
Preferred P/E of 17.5x: Is it justified for AF Gruppen?
AF Gruppen trades on a P/E of 17.5x at a last close of NOK189.2, which is higher than several benchmarks even though some models point to a discount to estimated fair value. That mix of signals puts the focus squarely on what the market is paying for each krone of earnings today.
The P/E ratio compares the share price to earnings per share, so a richer multiple usually means investors are willing to pay more for each unit of profit. For a contractor like AF Gruppen, where margins can be thin and project risk is real, that ratio often reflects how confident the market is in the durability and quality of earnings rather than just the next quarter.
On relative terms, the stock is described as expensive on 17.5x earnings compared with both the European Construction industry average of 14.8x and a peer group at 14.7x. It is also labelled expensive versus an estimated fair P/E of 17.4x, which implies only a narrow cushion between the current multiple and where valuation models suggest the ratio could migrate over time.
Explore the SWS fair ratio for AF Gruppen.
Result: Price-to-earnings of 17.5x (OVERVALUED)
Still, the AF Gruppen story can change quickly if new contracts are delayed or if thin construction margins come under pressure from cost overruns.
Find out about the key risks to this AF Gruppen narrative.
Another View: AF Gruppen Through The DCF Lens
The earnings multiple paints AF Gruppen as slightly expensive, yet the SWS DCF model points in the opposite direction. On that cash flow view, NOK189.2 sits about 16.6% below an estimated value of NOK226.87. This frames the current quote as a possible markdown rather than a premium. Which signal do you think deserves more weight?
Look into how the SWS DCF model arrives at its fair value.
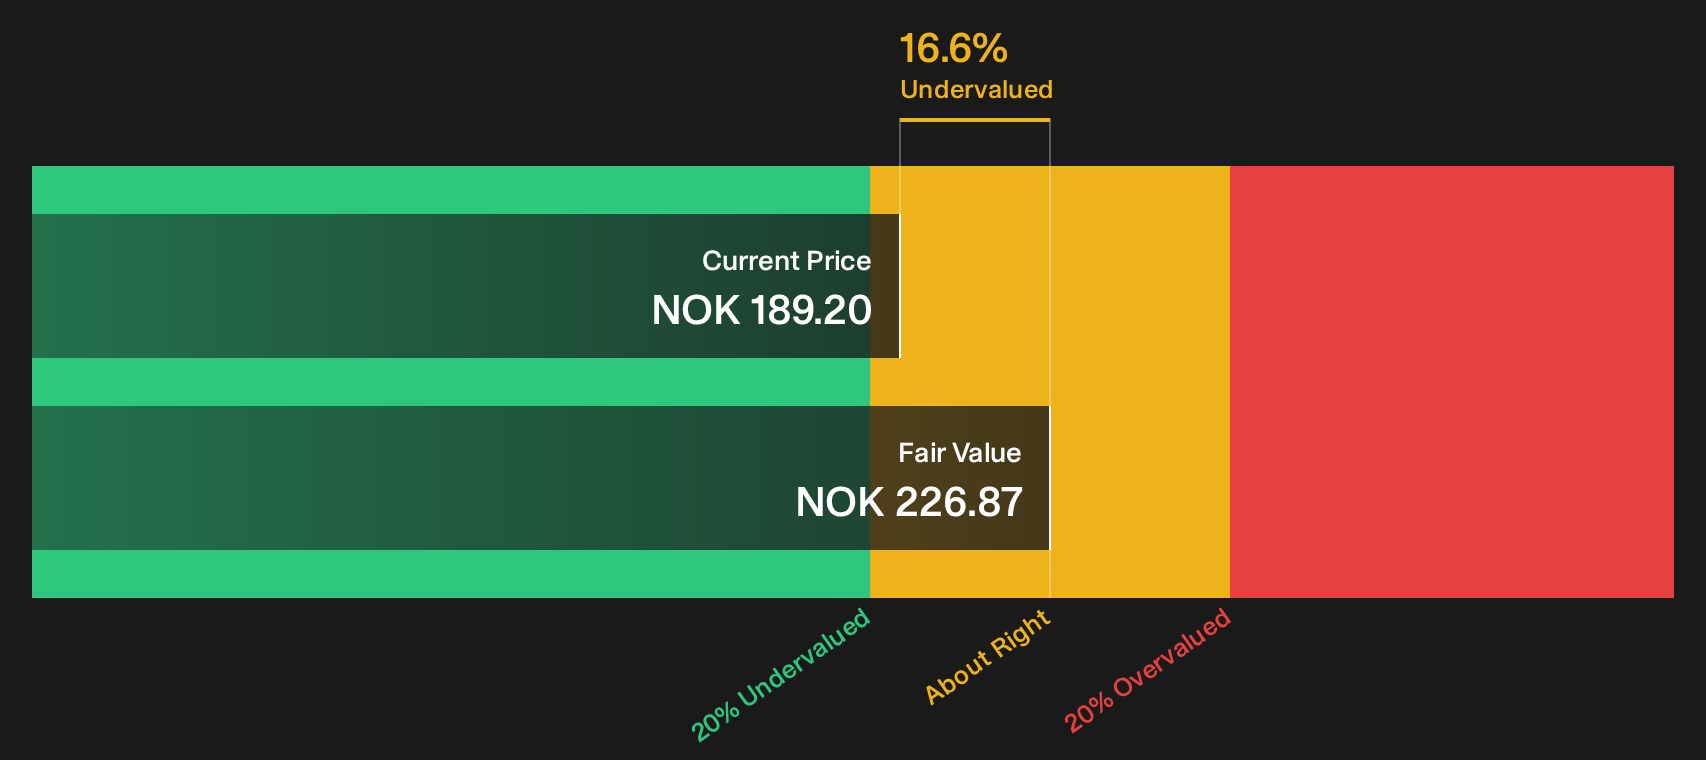
Simply Wall St performs a discounted cash flow (DCF) on every stock in the world every day (check out AF Gruppen for example). We show the entire calculation in full. You can track the result in your watchlist or portfolio and be alerted when this changes, or use our stock screener to discover 191 high quality undervalued stocks. If you save a screener we even alert you when new companies match - so you never miss a potential opportunity.
Next Steps
Sentiment around AF Gruppen is mixed, with both risk flags and upside drivers in play, so consider acting promptly and weighing the trade off for yourself. To see that balance in one place, review the 2 key rewards and 1 important warning sign
Looking for more AF Gruppen style investment ideas?
If AF Gruppen has sharpened your focus on quality, do not stop here. Use the Simply Wall Street screener to uncover more opportunities that fit your own criteria.
- Target resilient balance sheets and steady financial profiles by running the list of solid balance sheet and fundamentals (204 results) that filters for strength in capital heavy industries.
- Zero in on potential value opportunities by scanning the 191 high quality undervalued stocks that filters for quality fundamentals at prices that may not fully reflect them.
- Build a watchlist of potential future leaders by reviewing the 614 high quality undiscovered gems that highlights under-the-radar companies with solid underlying numbers.
This article by Simply Wall St is general in nature. We provide commentary based on historical data and analyst forecasts only using an unbiased methodology and our articles are not intended to be financial advice. It does not constitute a recommendation to buy or sell any stock, and does not take account of your objectives, or your financial situation. We aim to bring you long-term focused analysis driven by fundamental data. Note that our analysis may not factor in the latest price-sensitive company announcements or qualitative material. Simply Wall St has no position in any stocks mentioned.
Have feedback on this article? Concerned about the content? Get in touch with us directly. Alternatively, email editorial-team@simplywallst.com