


Taisei (TSE:1801) Wins MLIT Autonomous Logistics Trial, Is The Valuation Too Cheap?
Taisei (TSE:1801) just picked up fresh attention after Japan's Ministry of Land, Infrastructure, Transport and Tourism selected the group for an Autoflow Road autonomous logistics trial using unmanned vehicles in dedicated lanes.
For context, Taisei’s share price has fallen 11.31% over the past 30 days and 15.37% over 90 days, contributing to a year to date decline of 26.26%. Over five years, total shareholder return is 258.46%, which indicates substantial long-term compounding despite recent weaker momentum.
Spot opportunities in infrastructure and autonomous logistics by scanning Simply Wall St’s curated list of 42 power grid technology and infrastructure stocks.So is Taisei’s recent slide telling you something about the underlying business, or has sentiment simply swung too far after a strong multi year run, and what does that mean for the current valuation?
Price-to-Earnings of 10.7x: Is it justified?
On a simple snapshot, Taisei trades on a P/E of 10.7x, which leaves the share price near ¥11,290 looking only slightly cheaper than peers, yet still well below some valuation gauges that suggest more generous pricing could be justified.
The P/E ratio compares the current share price to earnings per share. For a construction and infrastructure contractor like Taisei, it gives a quick sense of how much investors are paying for each unit of profit in a sector where earnings can be cyclical and project based.
Taisei is described as expensive versus the broader JP Construction industry at 10.6x, a figure that is almost identical. The more striking comparison comes from the estimated fair P/E of 18x. That is materially higher than the current 10.7x, which suggests the market is valuing those earnings well below a level the fair ratio points to as reasonable, and highlights how far sentiment could shift if investors move closer to that benchmark.
In addition, the P/E of 10.7x is flagged as good value versus peer companies on an 11x average. This reinforces the idea that the current multiple is sitting under both peer and fair-value reference points in a way that looks conservative rather than stretched.
Explore the SWS fair ratio for Taisei.
Result: Price-to-Earnings of 10.7x (UNDERVALUED).
Still, Taisei’s exposure to cyclical construction demand, along with the wide remit of its development and real estate activities, could unsettle earnings if project pipelines soften.
Find out about the key risks to this Taisei narrative.
Another View: What The SWS DCF Model Says About Taisei
While the P/E of 10.7x points to Taisei looking modest against earnings, the SWS DCF model presents an even cheaper picture. With the share price around ¥11,290 and a future cash flow value estimated at ¥16,943.65, the stock appears undervalued on this lens as well. That kind of gap can reflect either mispricing or concern about how reliable those cash flows are, so which side do you think is closer to the truth?
Look into how the SWS DCF model arrives at its fair value.
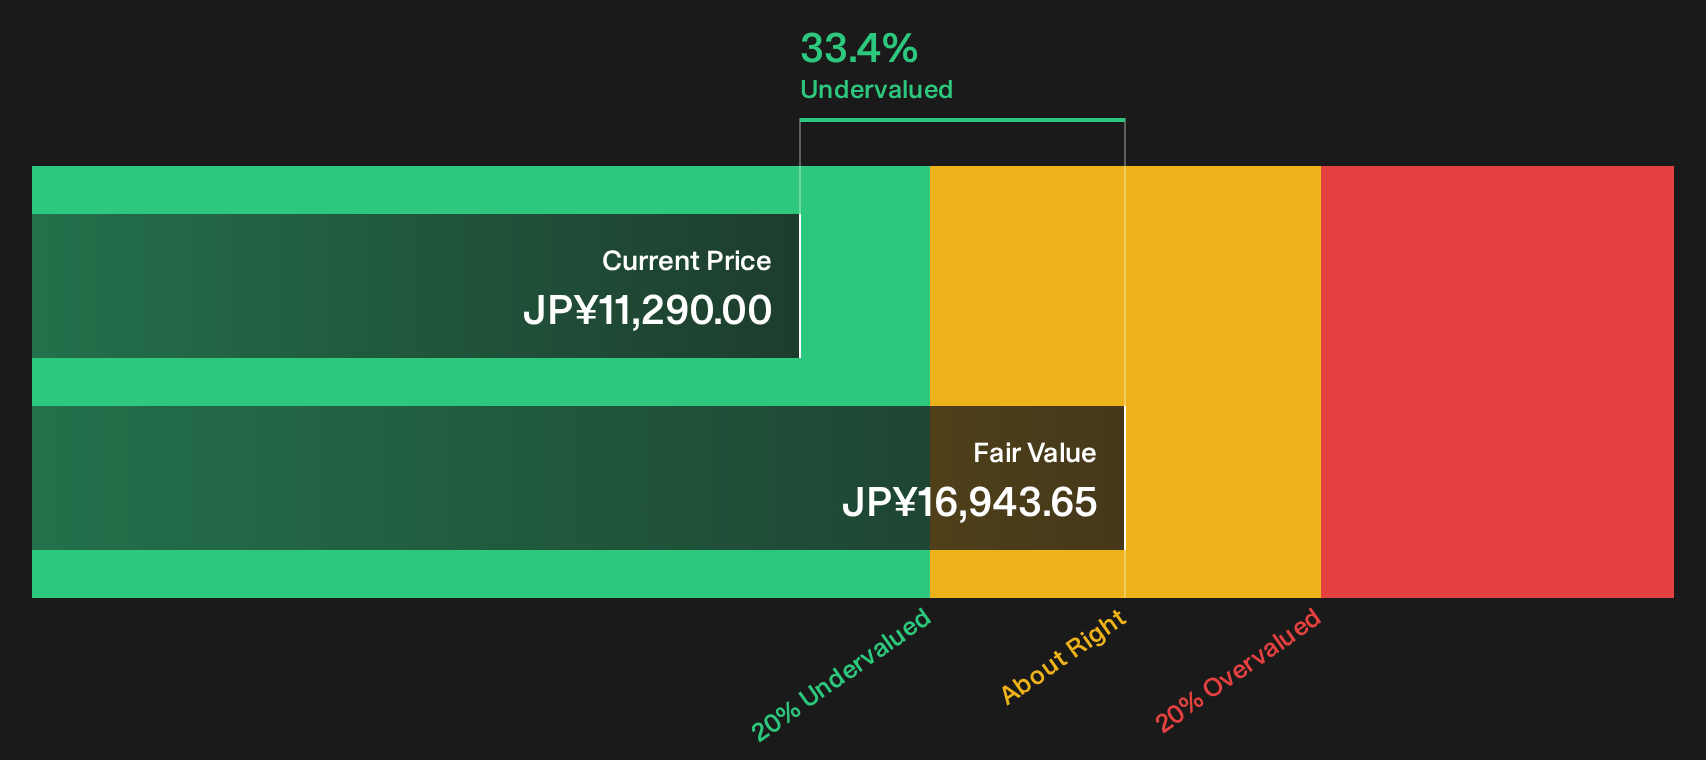
Simply Wall St performs a discounted cash flow (DCF) on every stock in the world every day (check out Taisei for example). We show the entire calculation in full. You can track the result in your watchlist or portfolio and be alerted when this changes, or use our stock screener to discover 13 high quality undervalued stocks. If you save a screener we even alert you when new companies match - so you never miss a potential opportunity.
Next Steps
Worried that the mixed tone around Taisei might be hiding something important beneath the surface of the recent pullback and valuation signals? Act quickly, review the same underlying data, and weigh both sides of the story by checking the 4 key rewards and 1 important warning sign.
Looking for more investment ideas beyond Taisei?
If Taisei has you thinking more carefully about price, quality, and risk, do not stop here. Cast the net wider and see how other opportunities compare.
- Target quality at a discount by scanning companies that screen well on valuation and fundamentals with the 13 high quality undervalued stocks.
- Secure potential income streams by focusing on reliable payers through the 29 dividend fortresses.
- Prioritize resilience and sleep easier at night by zeroing in on the 23 resilient stocks with low risk scores.
This article by Simply Wall St is general in nature. We provide commentary based on historical data and analyst forecasts only using an unbiased methodology and our articles are not intended to be financial advice. It does not constitute a recommendation to buy or sell any stock, and does not take account of your objectives, or your financial situation. We aim to bring you long-term focused analysis driven by fundamental data. Note that our analysis may not factor in the latest price-sensitive company announcements or qualitative material. Simply Wall St has no position in any stocks mentioned.
Have feedback on this article? Concerned about the content? Get in touch with us directly. Alternatively, email editorial-team@simplywallst.com