


Why Did Mohawk Industries (MHK) Stock Drop?
Mohawk Industries (MHK) has been drawing attention after a mixed stretch in its share performance, with the stock down over the past month but higher across the past 3 months.
At a share price of $120.29, Mohawk Industries has seen short-term momentum cool, with a 1 day share price return that fell 2.91% and a 30 day share price return down 4.60%. At the same time, the 90 day share price return is up 11.38% and the 3 year total shareholder return is 50.91%, pointing to a longer term recovery that contrasts with the weaker 1 year total shareholder return, which declined 5.55%.
Compare Mohawk Industries' mixed recent performance against a handpicked 33 high quality undervalued stocks that also shows improving fundamentals and potential for a rebound.
Mohawk Industries now sits at a tricky crossroads, where a soft recent share price and a stronger 3 year record tell different stories about progress and pessimism. Which side does the valuation actually support?
Most Popular Narrative: 11% Undervalued
On the most followed valuation view, Mohawk Industries screens below an implied fair value of $135.79 compared with the latest $120.29 close. That gap rests on measured growth, modest margin improvement, and a specific view of what investors might pay for those earnings.
Strategic investments in sustainability including product circularity, material optimization, and green energy are positioning Mohawk to capture premium pricing and expanded margins as more customers seek environmentally friendly flooring solutions. Ongoing digital and operational transformation through technology upgrades, automation, and supply chain optimization is projected to improve operational efficiency and drive net margin enhancement over the long term.
See why 8 investors see Mohawk Industries as 11% undervalued.
Behind that fair value of $135.79 sits a forecast revenue growth rate of about 2.2% a year, a profit margin profile moving from 4.2% toward 6.1%, and a future P/E of roughly 19.9x that is higher than the 14.4x level used for the broader US Consumer Durables group. The narrative uses an 8.86% discount rate to pull those future cash flows and multiples back to today, which helps explain why the model points to an 11.4% discount to its own estimate of worth even though analyst price targets cluster fairly close to each other.
That framework also sits alongside Simply Wall St's DCF output that values Mohawk Industries at $179.08, which is well above the current $120.29 trading level and approximately 32.8% above the price implied by the preferred multiple based fair value of $135.79. For readers, the key question is whether the underlying assumptions on mid single digit margins and low single digit top line growth feel conservative, aggressive, or roughly aligned with personal expectations for the flooring market and Mohawk Industries' ability to sustain its current positioning.
Result: Fair Value of $135.79 (UNDERVALUED)
Still, the Mohawk Industries story can be knocked off course if weak flooring demand lingers or if pricing pressure keeps chipping away at already thin margins.
Find out about the key risks to this Mohawk Industries narrative.
Another View: What Mohawk Industries' P/E Is Telling You
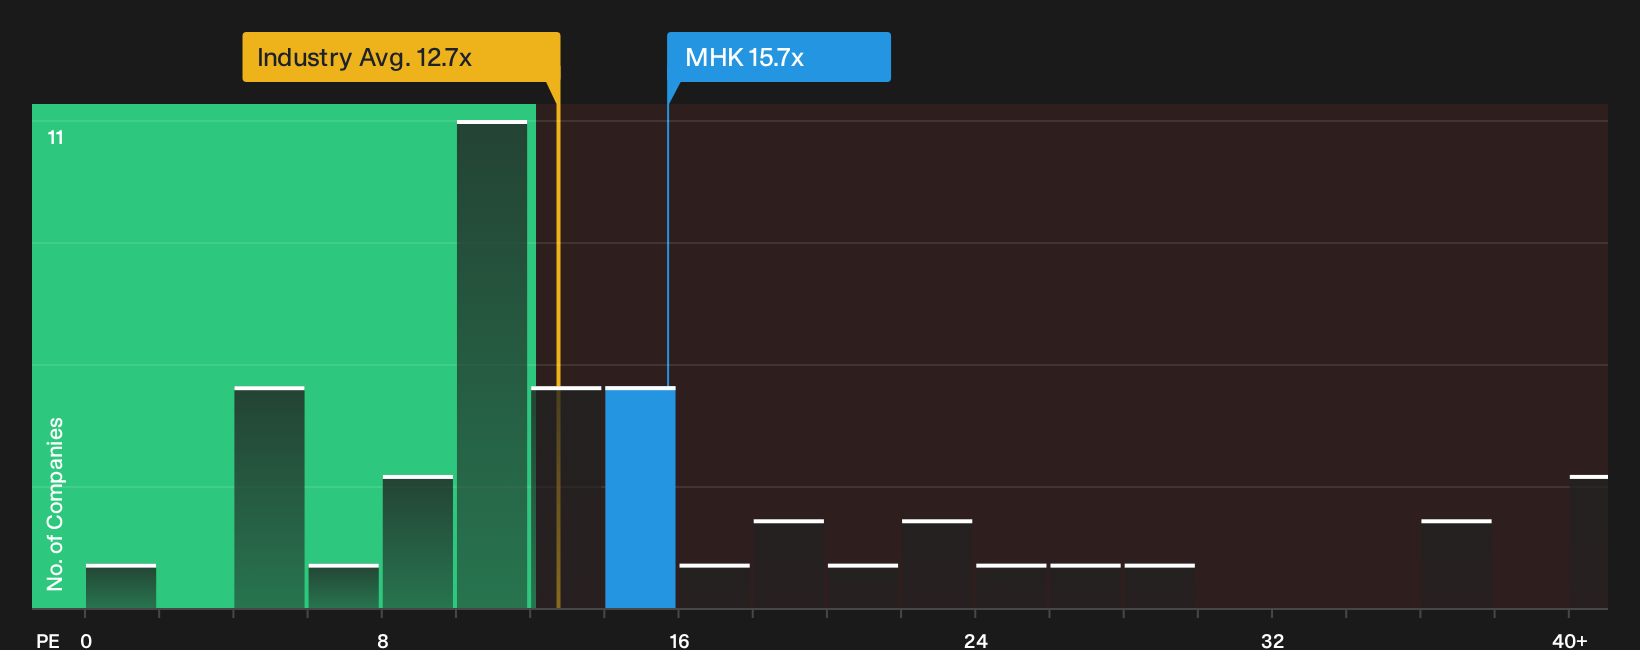
While the preferred fair value for Mohawk Industries points to an 11% discount, the current P/E of 15.7x tells a more cautious story. It sits above the US Consumer Durables average of 12.7x yet below a fair ratio of 19.1x. This suggests some valuation risk alongside room for re rating if execution improves.
To see how this price tag lines up with the underlying earnings profile and peer set, take a closer look at the detailed valuation breakdown, including the fair ratio and relative P/E context, in the See what the numbers say about this price — find out in our valuation breakdown..
Next Steps
Mixed messages on Mohawk Industries so far. If this leaves you torn, move quickly from headlines to hard data and weigh both the upside and the risks using the 2 key rewards and 2 important warning signs.
Looking for more investment ideas beyond Mohawk Industries?
If Mohawk Industries has sharpened your focus on valuation and quality, do not stop here. Broader opportunities can help round out your watchlist and future decisions.
- Target income resilience by reviewing potential high yield candidates in the 8 dividend fortresses.
- Hunt for mispriced quality by scanning the 20 high quality undiscovered gems before others catch on.
- Prioritize capital protection and review companies with steadier profiles using the 32 resilient stocks with low risk scores.
This article by Simply Wall St is general in nature. We provide commentary based on historical data and analyst forecasts only using an unbiased methodology and our articles are not intended to be financial advice. It does not constitute a recommendation to buy or sell any stock, and does not take account of your objectives, or your financial situation. We aim to bring you long-term focused analysis driven by fundamental data. Note that our analysis may not factor in the latest price-sensitive company announcements or qualitative material. Simply Wall St has no position in any stocks mentioned.
Have feedback on this article? Concerned about the content? Get in touch with us directly. Alternatively, email editorial-team@simplywallst.com