


Paycom Software (PAYC) Could Be 45% Undervalued As Profitability Optimism Builds
Paycom Software (PAYC) is back in the spotlight after upbeat commentary from TD Cowen and Oakmark Select Fund converged on the same theme. Both highlighted stronger profitability trends and the impact of recent cost savings and capital returns.
Recent optimism has arrived after a sharp reset. Paycom Software’s share price has climbed 70.1% over the past 90 days and 65.12% year to date to US$251.64, yet the 5-year total shareholder return is still down 51.74%. This suggests that the latest move reflects changing views on its earnings resilience more than a long, uninterrupted winning streak.
Compare Paycom Software's rebound and profitability focus with other hand picked opportunities using the 33 high quality undervalued stocks filter, which is built around cash flow strength and balance sheet quality.
After a 70% rebound in three months and a 5 year record that is still deeply underwater, is Paycom Software now pricing in most of the repair work, or leaving meaningful upside on the table?
Most Popular Narrative: 13% Overvalued
Paycom Software is trading at $251.64 compared with a narrative fair value of $222.59. This frames the recent surge as pricing in a lot of expected execution on profitability and automation already.
The main thing that has to go right is that Paycom continues to convert product usage and automation gains into healthy new bookings and cross sell across its roughly 5% share of the addressable market while maintaining world class service.
See why 82 investors see Paycom Software as 13% overvalued.
Result: Fair Value of $222.59 (OVERVALUED)
Still, the Paycom Software narrative depends on IWant remaining differentiated and on newer modules gaining traction, which could be challenged if rivals catch up or client adoption stalls.
Find out about the key risks to this Paycom Software narrative.
Another View: Cash Flows Paint A Very Different Picture For Paycom Software
The earlier narrative fair value of $222.59 frames Paycom Software as 13% overvalued on earnings based assumptions. The SWS DCF model points in the opposite direction, with an estimate of future cash flow value at $458.43, which is 45.1% above the current $251.64 share price. That gap suggests investors need to decide whether cash flow strength or earnings based multiples deserve more weight.
For readers who want to understand how this cash flow estimate is built step by step, Look into how the SWS DCF model arrives at its fair value.
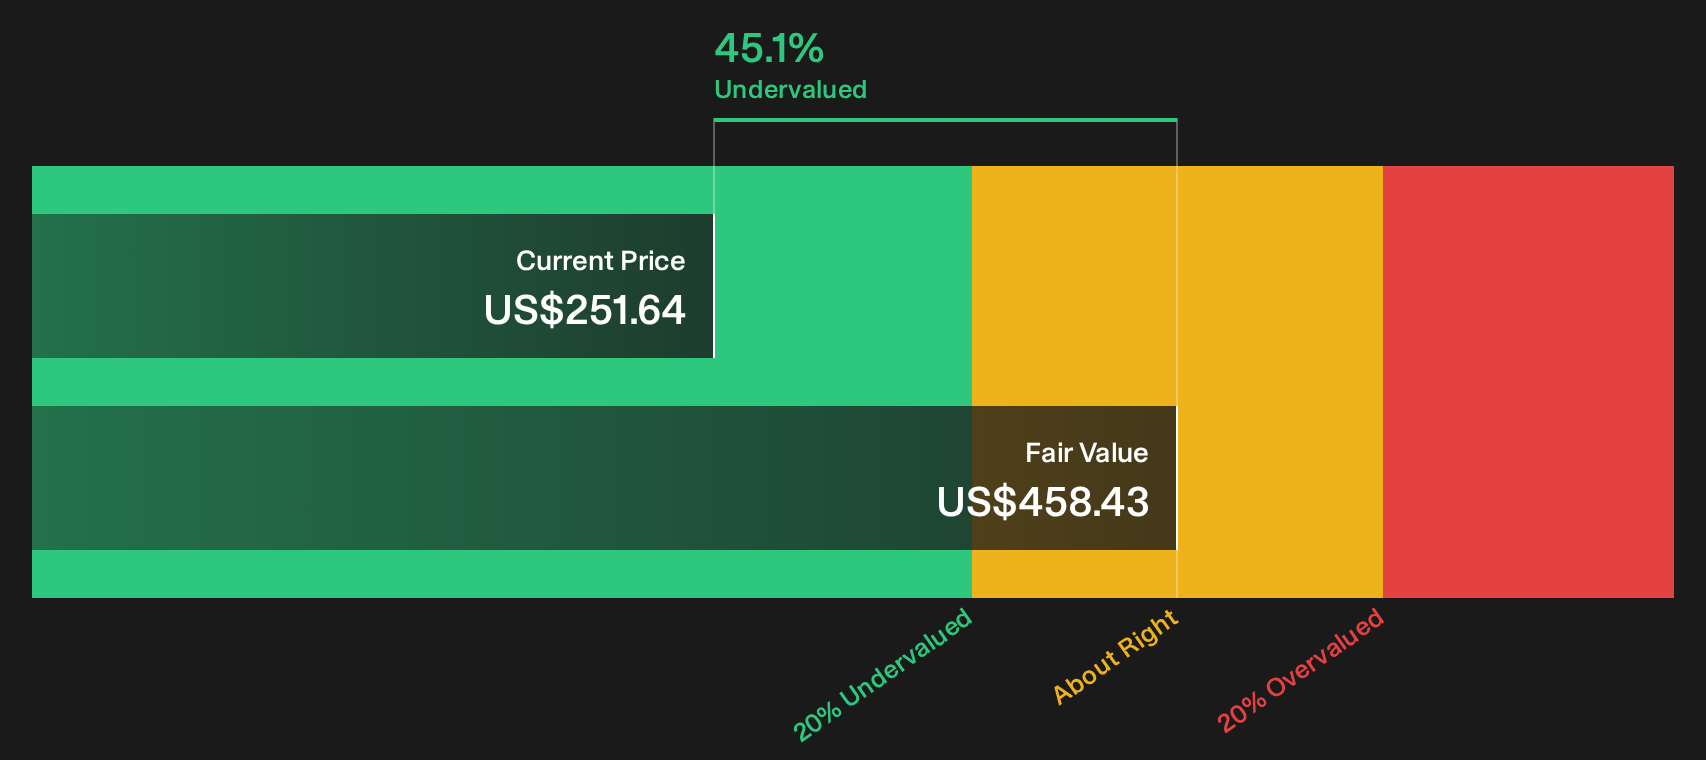
Simply Wall St performs a discounted cash flow (DCF) on every stock in the world every day (check out Paycom Software for example). We show the entire calculation in full. You can track the result in your watchlist or portfolio and be alerted when this changes, or use our stock screener to discover 33 high quality undervalued stocks. If you save a screener we even alert you when new companies match - so you never miss a potential opportunity.
Next Steps
Mixed signals like these around Paycom Software can be compelling or confusing. Move quickly to review both sides of the story and weigh the 3 key rewards and 2 important warning signs.
Looking for more investment ideas beyond Paycom Software?
If Paycom Software has sharpened your thinking, do not stop here. Use the Simply Wall St Screener to surface other opportunities that could better fit your goals.
- Target steadier compounding by scanning for resilient companies with 32 resilient stocks with low risk scores that aim to keep drawdowns and surprises in check.
- Zero in on financial strength by filtering for businesses backed by a list of solid balance sheet and fundamentals (25 results) so cash reserves and low debt support future decisions.
- Hunt for future leaders hiding in plain sight by reviewing a curated pool of 20 high quality undiscovered gems before the crowd catches on.
This article by Simply Wall St is general in nature. We provide commentary based on historical data and analyst forecasts only using an unbiased methodology and our articles are not intended to be financial advice. It does not constitute a recommendation to buy or sell any stock, and does not take account of your objectives, or your financial situation. We aim to bring you long-term focused analysis driven by fundamental data. Note that our analysis may not factor in the latest price-sensitive company announcements or qualitative material. Simply Wall St has no position in any stocks mentioned.
Have feedback on this article? Concerned about the content? Get in touch with us directly. Alternatively, email editorial-team@simplywallst.com