


Japan Airlines (TSE:9201) Could Be 34% Undervalued As Cargo Push Meets AI Demand
Japan Airlines (TSE:9201) expanded its cargo reach through a new partnership with Nippon Express, adding a dedicated Boeing 747 freighter loop between Los Angeles, Narita, Taipei and Singapore to serve high-demand AI and semiconductor shipments.
Japan Airlines’ latest cargo move lands at a time when the share price has been relatively flat this year, with a 0.19% year-to-date share price return and a 5.20% total shareholder return over 1 year, suggesting modest momentum rather than a strong trend either way.
Scan how Japan Airlines fits into the wider freight and AI supply chain story by weighing it up against our curated 55 AI infrastructure stocks.
Bulls see Japan Airlines using the Nippon Express cargo link to tap AI freight demand. Bears point to the muted share price. Which side do the current valuation and fundamentals lean toward from here?
Preferred P/E of 11.4x: Is it justified for Japan Airlines?
On simple earnings terms, Japan Airlines trades on a P/E of 11.4x at a last close of ¥2,952, which screens as inexpensive relative to several reference points that investors usually watch.
The P/E ratio compares the current share price with earnings per share, so it reflects how much investors are willing to pay for each unit of profit. For an airline with a mix of full service, low cost, and cargo activities, this matters because earnings can be cyclical, and the multiple often signals how the market prices that variability.
For Japan Airlines, that 11.4x multiple sits below the JP market P/E of 13.7x, below the Asian Airlines industry average of 14x, and below an estimated fair P/E of 17.3x. The combination suggests the market is pricing its earnings more cautiously than both peers and the fair ratio implied by the SWS model, even while the business is forecast to grow earnings 8.85% per year and is described as having high quality earnings.
Relative to the airline peer group, the discount is clear. Trading at what appears to be good value compared to both the Asian Airlines industry average P/E and the peer set, Japan Airlines is being valued at a lower earnings multiple than a level the fair ratio suggests the market could move toward if sentiment or performance were to align with those estimates.
Explore the SWS fair ratio for Japan Airlines.
Result: Price-to-Earnings of 11.4x (UNDERVALUED).
Still, the cargo story can be knocked off course if high-demand AI shipments soften, or if broader travel and freight volumes undercut Japan Airlines’ earnings base.
Find out about the key risks to this Japan Airlines narrative.
Another View: SWS DCF model points the other way
The SWS DCF model paints a very different picture. On this approach, Japan Airlines at ¥2,952 trades well above an estimated future cash flow value of ¥1,528.93, which screens as overvalued rather than cheap.
That gap raises a simple question for you. Is the earnings multiple giving a better read on Japan Airlines right now, or is the cash flow model closer to the mark?
Look into how the SWS DCF model arrives at its fair value.
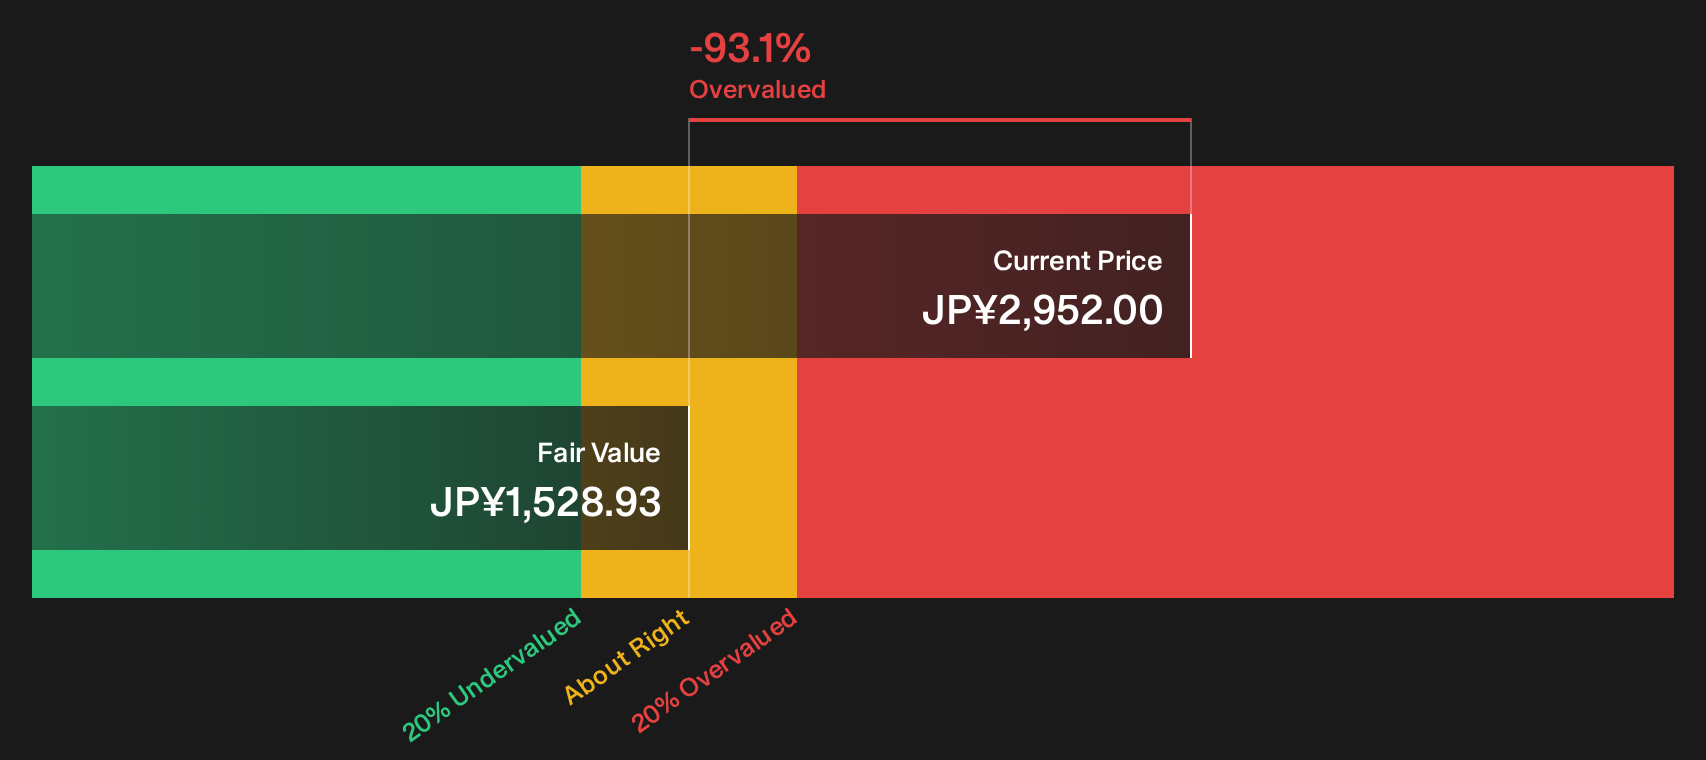
Simply Wall St performs a discounted cash flow (DCF) on every stock in the world every day (check out Japan Airlines for example). We show the entire calculation in full. You can track the result in your watchlist or portfolio and be alerted when this changes, or use our stock screener to discover 14 high quality undervalued stocks. If you save a screener we even alert you when new companies match - so you never miss a potential opportunity.
Next Steps
Mixed signals around Japan Airlines can pull you in either direction, so move quickly, check the data for yourself and weigh the 3 key rewards and 1 important warning sign.
Looking for more investment ideas beyond Japan Airlines?
If Japan Airlines has your attention, do not stop there. Broader opportunities often sit just outside the first idea you research.
- Target potential mispricing by scanning a curated pool of companies that screen as attractively valued through the 14 high quality undervalued stocks.
- Strengthen your downside protection by focusing on businesses with robust finances using the list of solid balance sheet and fundamentals (21 results).
- Hunt for under-the-radar opportunities before the crowd catches on by checking the 73 high quality undiscovered gems.
This article by Simply Wall St is general in nature. We provide commentary based on historical data and analyst forecasts only using an unbiased methodology and our articles are not intended to be financial advice. It does not constitute a recommendation to buy or sell any stock, and does not take account of your objectives, or your financial situation. We aim to bring you long-term focused analysis driven by fundamental data. Note that our analysis may not factor in the latest price-sensitive company announcements or qualitative material. Simply Wall St has no position in any stocks mentioned.
Have feedback on this article? Concerned about the content? Get in touch with us directly. Alternatively, email editorial-team@simplywallst.com