


Prosperity Bancshares (PB) Just Gave Investors Something To Think About
Prosperity Bancshares (PB) has been in focus after a 40.8% share price gain over three years. This has prompted questions about whether recent returns align with the bank’s underlying profitability and capital efficiency.
Over the past year, Prosperity Bancshares has delivered an 11.05% total shareholder return even as the 30 day share price return is down 3.63%. This suggests that recent weakness follows a stronger three year total return of 47.97%, rather than a collapse in the longer term story.
Scan how Prosperity Bancshares stacks up against other profitable regional lenders by reviewing our hand picked list of solid balance sheet and fundamentals (25 results).
Bulls point to Prosperity Bancshares earning more on shareholder funds than the model requires, while bears focus on the recent pullback and credit risk. Which side does the current valuation actually support?
Most Popular Narrative: 17% Undervalued
Prosperity Bancshares last closed at $67.79, while the most followed narrative places fair value closer to $81.54, framing the recent share price wobble as a discount rather than a stretch.
Completion of the American Bank, Texas Partners and Stellar transactions positions Prosperity Bancshares to consolidate a larger Texas and Oklahoma footprint. Management has pointed to about US$100 to US$110 million of annual pretax cost savings that would directly support a lower efficiency ratio and higher net earnings power once integration is complete.
See why 3 investors see Prosperity Bancshares as 17% undervalued.
Result: Fair Value of $81.54 (UNDERVALUED)
Still, rising nonperforming assets and the spike to US$41.3 million in net charge offs, along with flat legacy loan balances in 2026, could easily challenge that optimism.
Find out about the key risks to this Prosperity Bancshares narrative.
Another View: Prosperity Bancshares Through The P/E Lens
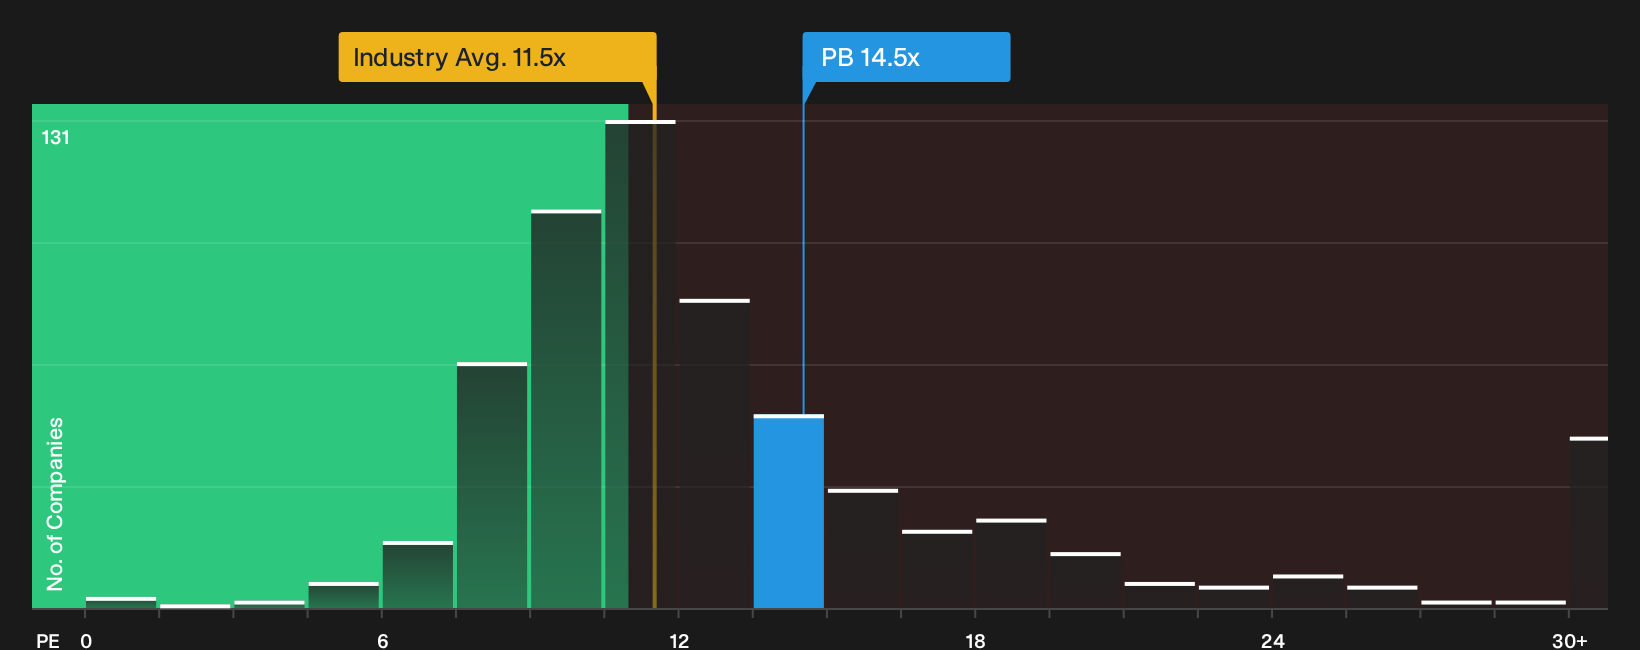
There is a wrinkle. While Prosperity Bancshares looks inexpensive against an $81.54 fair value, its current P/E of 14.5x is richer than both US Banks at 11.4x and peers at 11.3x, and only slightly below a fair ratio of 15.3x. Is that gap a margin of safety or a pricing risk?
To understand how that 14.5x multiple could converge toward the fair ratio over time, and what that might mean for upside or downside, it helps to walk through the detailed valuation work behind it. Start with our preferred earnings framework and the assumptions that feed into it, then link those inputs back to recent results and forecast trends, before you weigh your own expectations against the market price. See what the numbers say about this price — find out in our valuation breakdown.
Next Steps
Mixed messages on Prosperity Bancshares so far, right, with both pressure points and bright spots in the data. Act while the details are fresh and weigh the full picture for yourself by reviewing the 4 key rewards and 2 important warning signs
Looking For More Investment Ideas Beyond Prosperity Bancshares?
If Prosperity Bancshares has caught your attention, do not stop there. Let the same disciplined approach point you toward other potential portfolio candidates.
Use the Simply Wall St Screener to keep your opportunity set fresh and focused.
- Target strong cash generation and balance sheet resilience by reviewing a curated 33 high quality undervalued stocks that may line up with your return and risk preferences.
- Strengthen your income stream by assessing companies in the 8 dividend fortresses that combine higher yields with disciplined payout profiles.
- Protect your downside with the 32 resilient stocks with low risk scores that concentrates on resilient businesses with sturdier financial risk scores.
This article by Simply Wall St is general in nature. We provide commentary based on historical data and analyst forecasts only using an unbiased methodology and our articles are not intended to be financial advice. It does not constitute a recommendation to buy or sell any stock, and does not take account of your objectives, or your financial situation. We aim to bring you long-term focused analysis driven by fundamental data. Note that our analysis may not factor in the latest price-sensitive company announcements or qualitative material. Simply Wall St has no position in any stocks mentioned.
Have feedback on this article? Concerned about the content? Get in touch with us directly. Alternatively, email editorial-team@simplywallst.com