


Investor (OM:INVE A) Faces A Valuation Test On Mixed 2026 Results
Investor (OM:INVE A) has released third quarter and nine month 2026 figures, reporting higher sales in both periods but a sharp third quarter net income drop that contrasts with stronger year to date profit.
Recent trading points to solid momentum in Investor’s shares, with a 1 month share price return of 3.94% and a year to date share price gain of 27.13% at a latest price of SEK413.8, while the 5 year total shareholder return of 127.88% underlines how longer term holders have fared.
Scan how Investor’s earnings swing compares with other financial companies by reviewing the hand-picked 191 high quality undervalued stocks that currently pair balance sheet strength with priced-in caution.
After a 27.13% gain this year and a sharp swing between quarterly and nine month earnings, Investor now asks holders to weigh richer optimism against fresh profit volatility. Does that balance still reward new buyers at this price?
Preferred P/E of 4.8x: Is it justified for Investor?
On the latest figures, Investor trades on a P/E of 4.8x while the SWS DCF model points to a future cash flow value of SEK1,133.18 per share against a last close of SEK413.8. That combination puts a low earnings multiple next to a DCF estimate that is far above where the market currently prices the stock.
P/E compares the share price with earnings per share, so a 4.8x reading indicates that investors are paying 4.8 years of current earnings for Investor. For a diversified financial group that reports what is described as high quality earnings and an 80.1% net profit margin, such a low ratio suggests the market is not paying up much for those profits.
The comparison work in the data is blunt. Management sits on a 4.8x P/E while the peer group averages 11.7x, and the wider European diversified financial industry is on 10.1x. The fair P/E our model estimates is 9.9x. The valuation analysis implies the market could move towards that level if sentiment on earnings strength and balance sheet quality shifted.
Explore the SWS fair ratio for Investor.
Result: Price-to-earnings of 4.8x (UNDERVALUED)
Still, the sharp annual decline in net income growth and Investor’s role as a private equity owner leave the thesis exposed to weaker deal exits or lower portfolio valuations.
Find out about the key risks to this Investor narrative.
Another View: What The SWS DCF Model Says About Investor
The P/E work presents Investor as inexpensive, and the SWS DCF model goes further by putting future cash flow value at SEK1,133.18 per share compared with a market price of SEK413.8. That is a very wide gap. Is the market being too cautious on those projected cash flows, or are the inputs too generous?
Look into how the SWS DCF model arrives at its fair value.
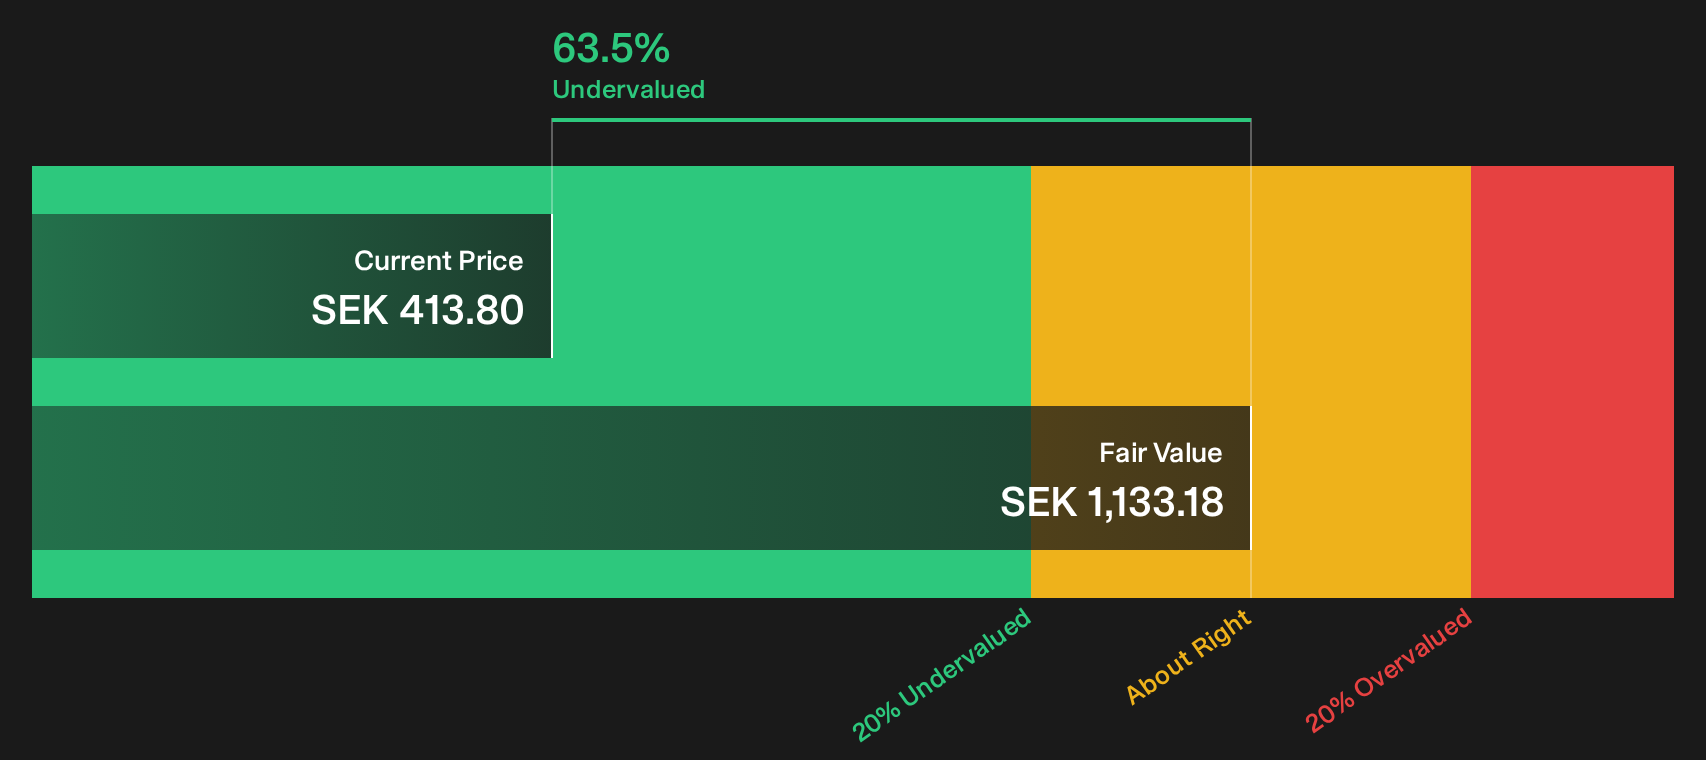
Simply Wall St performs a discounted cash flow (DCF) on every stock in the world every day (check out Investor for example). We show the entire calculation in full. You can track the result in your watchlist or portfolio and be alerted when this changes, or use our stock screener to discover 191 high quality undervalued stocks. If you save a screener we even alert you when new companies match - so you never miss a potential opportunity.
Next Steps
Mixed signals on valuation and earnings usually split opinion, so treat this as a prompt to move quickly, review Investor’s data for yourself, and weigh both the 4 key rewards and 1 important warning sign.
Looking for more investment ideas beyond Investor?
If Investor is already on your radar, do not stop there. Fresh opportunities often emerge where pricing, balance sheet strength, and income potential quietly line up.
- Target potential mispricing by scanning companies that combine strong fundamentals with cautious expectations through the 191 high quality undervalued stocks.
- Strengthen your core holdings by reviewing a list of solid balance sheet and fundamentals (203 results) that can better handle shocks when conditions turn tough.
- Build a stream of income by focusing on 213 dividend fortresses that pair high yields with resilient profiles.
This article by Simply Wall St is general in nature. We provide commentary based on historical data and analyst forecasts only using an unbiased methodology and our articles are not intended to be financial advice. It does not constitute a recommendation to buy or sell any stock, and does not take account of your objectives, or your financial situation. We aim to bring you long-term focused analysis driven by fundamental data. Note that our analysis may not factor in the latest price-sensitive company announcements or qualitative material. Simply Wall St has no position in any stocks mentioned.
Have feedback on this article? Concerned about the content? Get in touch with us directly. Alternatively, email editorial-team@simplywallst.com