


Is CBL & Associates Properties (CBL) Fairly Valued On Its Refinancing And Dividend News?
CBL & Associates Properties (CBL) just paired a fresh refinancing of its West County Center mortgage with an affirmed quarterly cash dividend, putting both its debt schedule and shareholder payouts in clear focus for investors.
Those refinancing and dividend moves land against a mixed tape for CBL & Associates Properties, with the share price up 1.29% on the day and 33.96% year to date, even as the 30 day share price return declined 6.77% and the 90 day share price return fell 10.49%.
For income focused holders, the bigger story has been compounding payouts, reflected in a 1 year total shareholder return of 78.65% and a 3 year total shareholder return of 197.01%. This indicates that recent price volatility sits within a much stronger multi year recovery narrative.
Spot opportunities beyond CBL & Associates Properties by scanning a hand picked list of solid balance sheet and fundamentals (25 results) that echoes the same focus on debt terms, free cash flow, and dividend resilience.The refinancing and dividend decision has pulled CBL & Associates Properties higher over the past year. However, recent pullbacks leave a real fork in the road for investors: lean in after this move, or wait for a cleaner entry?
Preferred P/E of 7.2x: Is it justified?
On current numbers, CBL & Associates Properties trades on a P/E of 7.2x, which puts the $49.47 share price at a clear discount to both peers and the wider US market.
The P/E ratio compares what investors are paying today for each dollar of reported earnings. For a retail REIT like CBL & Associates Properties, that yardstick gives a quick sense of how the market is weighing its income stream against other listed property owners.
Here, the gap is wide. The stock sits on 7.2x earnings versus a US Retail REITs average of 26.5x and a US market level of 18.2x. This suggests investors are pricing in meaningfully weaker durability of profits. At the same time, the estimated fair P/E of 7.4x is very close to the current 7.2x, so the valuation level could easily shift if perceptions around earnings quality or balance sheet risk change.
Explore the SWS fair ratio for CBL & Associates Properties.
Result: Price-to-Earnings of 7.2x (UNDERVALUED)
Still, the CBL & Associates Properties story can be knocked off course by pressure on retail tenants or by any renewed deterioration in net income trends.
Find out about the key risks to this CBL & Associates Properties narrative.
Another view on CBL & Associates Properties valuation
The low 7.2x P/E presents CBL & Associates Properties as inexpensive. However, the SWS DCF model points in the opposite direction, with an estimated future cash flow value of $42.88 compared to the current $49.47 share price, which appears overvalued on that measure. Which signal should carry more weight for you right now?
Look into how the SWS DCF model arrives at its fair value.
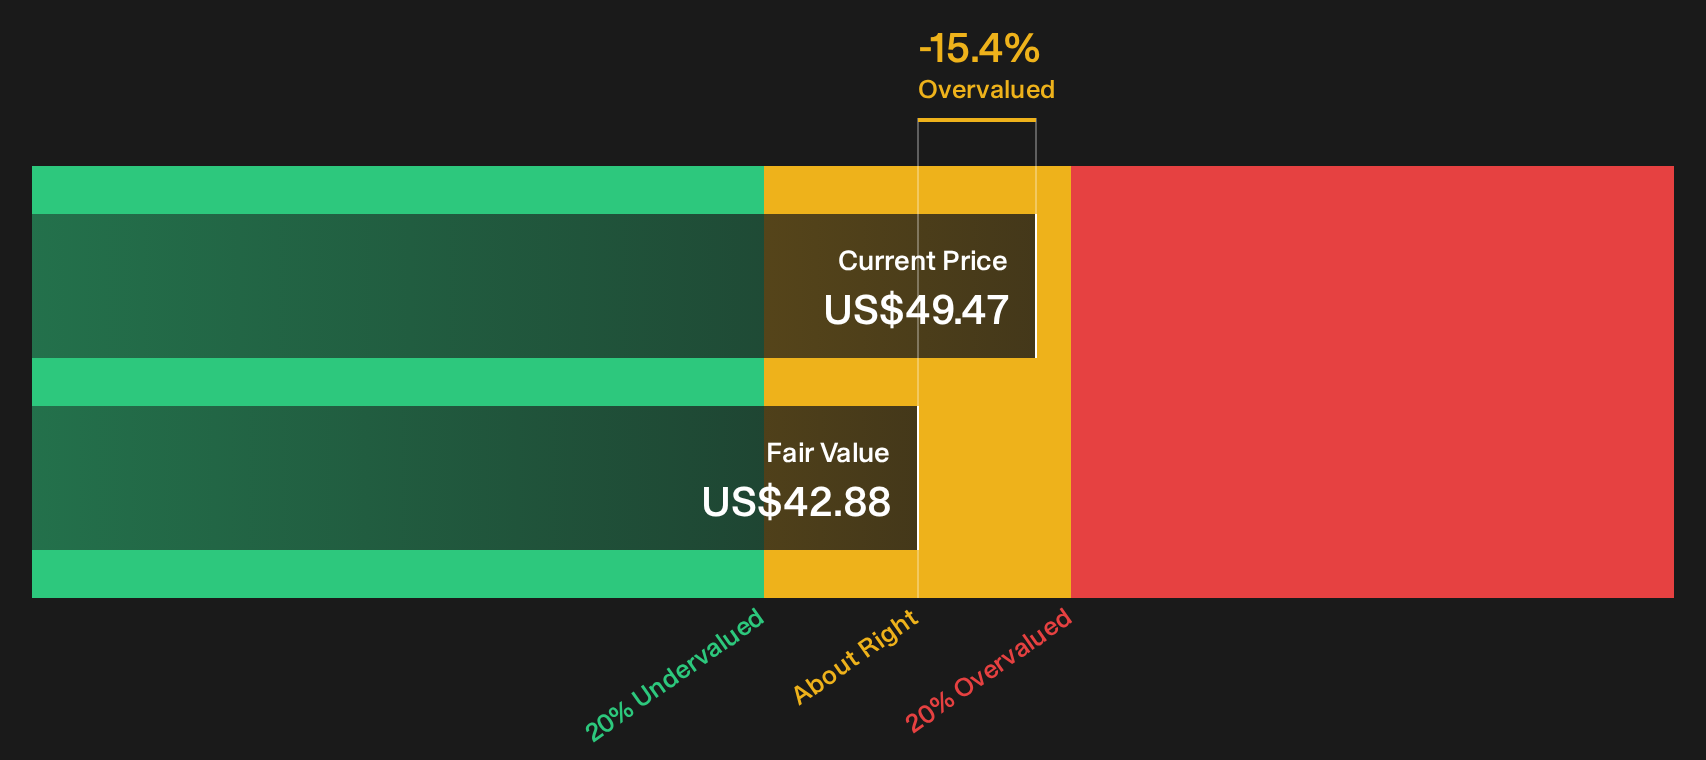
Simply Wall St performs a discounted cash flow (DCF) on every stock in the world every day (check out CBL & Associates Properties for example). We show the entire calculation in full. You can track the result in your watchlist or portfolio and be alerted when this changes, or use our stock screener to discover 33 high quality undervalued stocks. If you save a screener we even alert you when new companies match - so you never miss a potential opportunity.
Next Steps
The mix of risks and rewards around CBL & Associates Properties is clear enough on paper, but the decision is still yours and time sensitive. To weigh those trade offs using the same data set, start with the 3 key rewards and 4 important warning signs
Looking for more investment ideas beyond CBL & Associates Properties?
Do not stop with CBL & Associates Properties when the broader market is full of different setups and risk profiles that might suit your next move better.
- Target higher potential upside while staying selective by scanning 14 elite penny stocks with strong financials that combine smaller market caps with stronger financial footing.
- Focus on value opportunities by using the 33 high quality undervalued stocks to spot companies where quality fundamentals line up with compressed valuation multiples.
- Prioritise capital preservation by turning to the 32 resilient stocks with low risk scores and concentrate on businesses with more resilient balance sheets and lower overall risk scores.
This article by Simply Wall St is general in nature. We provide commentary based on historical data and analyst forecasts only using an unbiased methodology and our articles are not intended to be financial advice. It does not constitute a recommendation to buy or sell any stock, and does not take account of your objectives, or your financial situation. We aim to bring you long-term focused analysis driven by fundamental data. Note that our analysis may not factor in the latest price-sensitive company announcements or qualitative material. Simply Wall St has no position in any stocks mentioned.
Have feedback on this article? Concerned about the content? Get in touch with us directly. Alternatively, email editorial-team@simplywallst.com