


Headwater Exploration (TSX:HWX) Draws Income Interest As Valuation Stays In Focus
Headwater Exploration (TSX:HWX) has drawn fresh attention after investors focused on its disciplined spending, low cost operations and commitment to sustainable shareholder distributions, including a dividend yield recently cited at about 3.85%.
Recent trading has been strong, with the share price at about CA$14.67. Short term momentum is reflected in a 7 day share price return of 5.09% and a 90 day share price return of 14.88%. Longer term investors have seen a 1 year total shareholder return of 119.19% and a 5 year total shareholder return of 292.61%, pointing to sustained interest around Headwater Exploration’s disciplined model.
Spot opportunities with a similar balance of income and resilience by scanning our curated list of 3 dividend fortresses alongside Headwater Exploration.Recent gains in Headwater Exploration raise a simple tension. Are investors rewarding a sturdier, dividend backed business model, or leaning into short term enthusiasm around the stock’s momentum and current valuation metrics?
Price-to-Earnings of 18.7x: Is it justified for Headwater Exploration?
On recent numbers, Headwater Exploration trades on a P/E of 18.7x while sitting below both its own SWS DCF fair value estimate of CA$18.95 and the average P/E levels seen across peers. That mix of a discounted cash flow assessment and a lower multiple than comparable oil and gas stocks sets up an interesting valuation puzzle for investors weighing momentum against fundamentals.
The P/E ratio compares the current share price to earnings per share. For a producer like Headwater Exploration, it reflects what the market is prepared to pay for each dollar of profit, which can matter a lot in a sector where earnings often swing with commodity prices. A P/E of 18.7x suggests investors are paying a moderate premium to current earnings, not a rock bottom level but also not stretched when set against its profitability.
Context around quality helps this multiple make more sense. Headwater Exploration reports high quality earnings, a 22.9% Return on Equity that is described as high, and earnings growth over the past 5 years averaging 17.9% per year. Recent profit expansion of 0.9% is well above the broader Canadian Oil and Gas industry figure of 0.2%, even though margins have softened from 35.1% to 31.4%. Those traits indicate a business that has turned past reinvestment into strong returns on shareholder capital, which can often support a firmer earnings multiple.
The relative picture against peers is clear. At 18.7x, Headwater Exploration trades on a lower P/E than both the Canadian Oil and Gas industry average of 20.9x and the relevant peer group average of 26.1x. The stock is described as good value on this basis, which means the market is currently assigning a cheaper price to its earnings than it does to many similar energy producers.
See what the numbers say about this price — find out in our valuation breakdown.
Result: Price-to-Earnings of 18.7x (UNDERVALUED).
Still, the Headwater Exploration story can change quickly if commodity prices weaken or if development spending needs rise. This could pressure earnings and dividends.
Find out about the key risks to this Headwater Exploration narrative.
Another view on Headwater Exploration’s value
A different lens on Headwater Exploration comes from its SWS DCF model, which puts fair value at about CA$18.95 per share versus the recent CA$14.67 price. That implies the stock trades at a discount, but the real question is how durable those future cash flow assumptions prove to be.
Investors who want to see how that cash flow based estimate is built line by line can go straight to the detailed model, then decide how much weight to give it beside simple earnings multiples. Look into how the SWS DCF model arrives at its fair value.
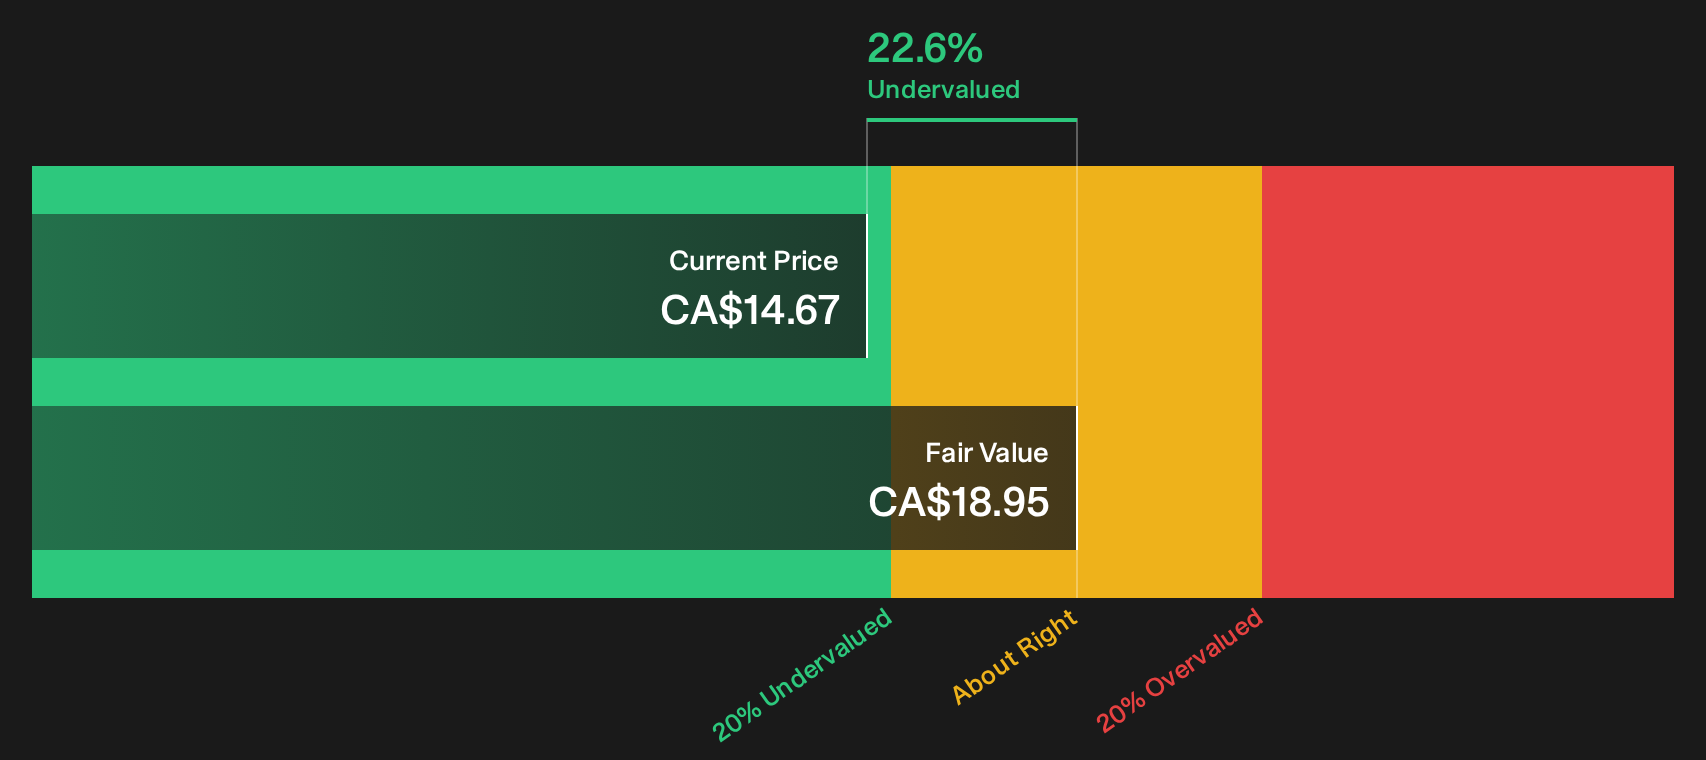
Simply Wall St performs a discounted cash flow (DCF) on every stock in the world every day (check out Headwater Exploration for example). We show the entire calculation in full. You can track the result in your watchlist or portfolio and be alerted when this changes, or use our stock screener to discover 5 high quality undervalued stocks. If you save a screener we even alert you when new companies match - so you never miss a potential opportunity.
Next Steps
Uncertain whether Headwater Exploration’s recent run reflects underlying quality or simply momentum in the share price? Consider the available information carefully and examine both sides of the story by checking the 2 key rewards and 1 important warning sign
Looking for more investment ideas beyond Headwater Exploration?
Headwater Exploration gives a useful reference point, but your portfolio benefits when you keep hunting for fresh ideas with solid income, quality and resilience.
- Target reliable cash generators by scanning a curated 3 dividend fortresses that complement Headwater Exploration style income potential.
- Zero in on potential value opportunities early through a focused 10 high quality undiscovered gems that many investors may be overlooking.
- Anchor your watchlist around financial strength by using a list of solid balance sheet and fundamentals (8 results) that can help you stay prepared before the next market swing.
This article by Simply Wall St is general in nature. We provide commentary based on historical data and analyst forecasts only using an unbiased methodology and our articles are not intended to be financial advice. It does not constitute a recommendation to buy or sell any stock, and does not take account of your objectives, or your financial situation. We aim to bring you long-term focused analysis driven by fundamental data. Note that our analysis may not factor in the latest price-sensitive company announcements or qualitative material. Simply Wall St has no position in any stocks mentioned.
Have feedback on this article? Concerned about the content? Get in touch with us directly. Alternatively, email editorial-team@simplywallst.com