


Wondering Why Alibaba Group Fell? Here's What The Bears Saw
If you had paused in October 2025 and decided not to touch Alibaba Group because the bullish and bearish write ups seemed too far apart, that choice now looks very different in light of fresh headlines on AI spending, class actions and new share issuance. Investors who held Alibaba Group over the past year are down 34.1%, including dividends. Faced with that outcome, which early warning in the original growth, margin or P/E assumptions would you focus on first?
A Narrative on Simply Wall St is one investor's written case for a company, with its growth, margin and multiple assumptions spelled out. Those assumptions imply an estimated Fair Value.
The move put Alibaba Group in the middle of this trade. Scan 55 AI infrastructure stocks for other companies exposed to it.
The Two Alibaba Stories Investors Had To Weigh
The shares cost US$165 at the start of the period, and you were choosing between two very different stories about Alibaba Group.
The bullish narrative put fair value at US$180 and relied on Alibaba committing RMB 380b over three years to AI and cloud, with assumed revenue growth of 8.7% and profit margins at 14.0%. This view was supported by a future P/E of 3.0x over three years.
The bearish case set fair value at US$107 and still assumed revenue growth of 14.1% with 13.0% profit margins. It argued that US China trade risks and regulatory pressure could weigh on that 15.2x future P/E over a five year span.
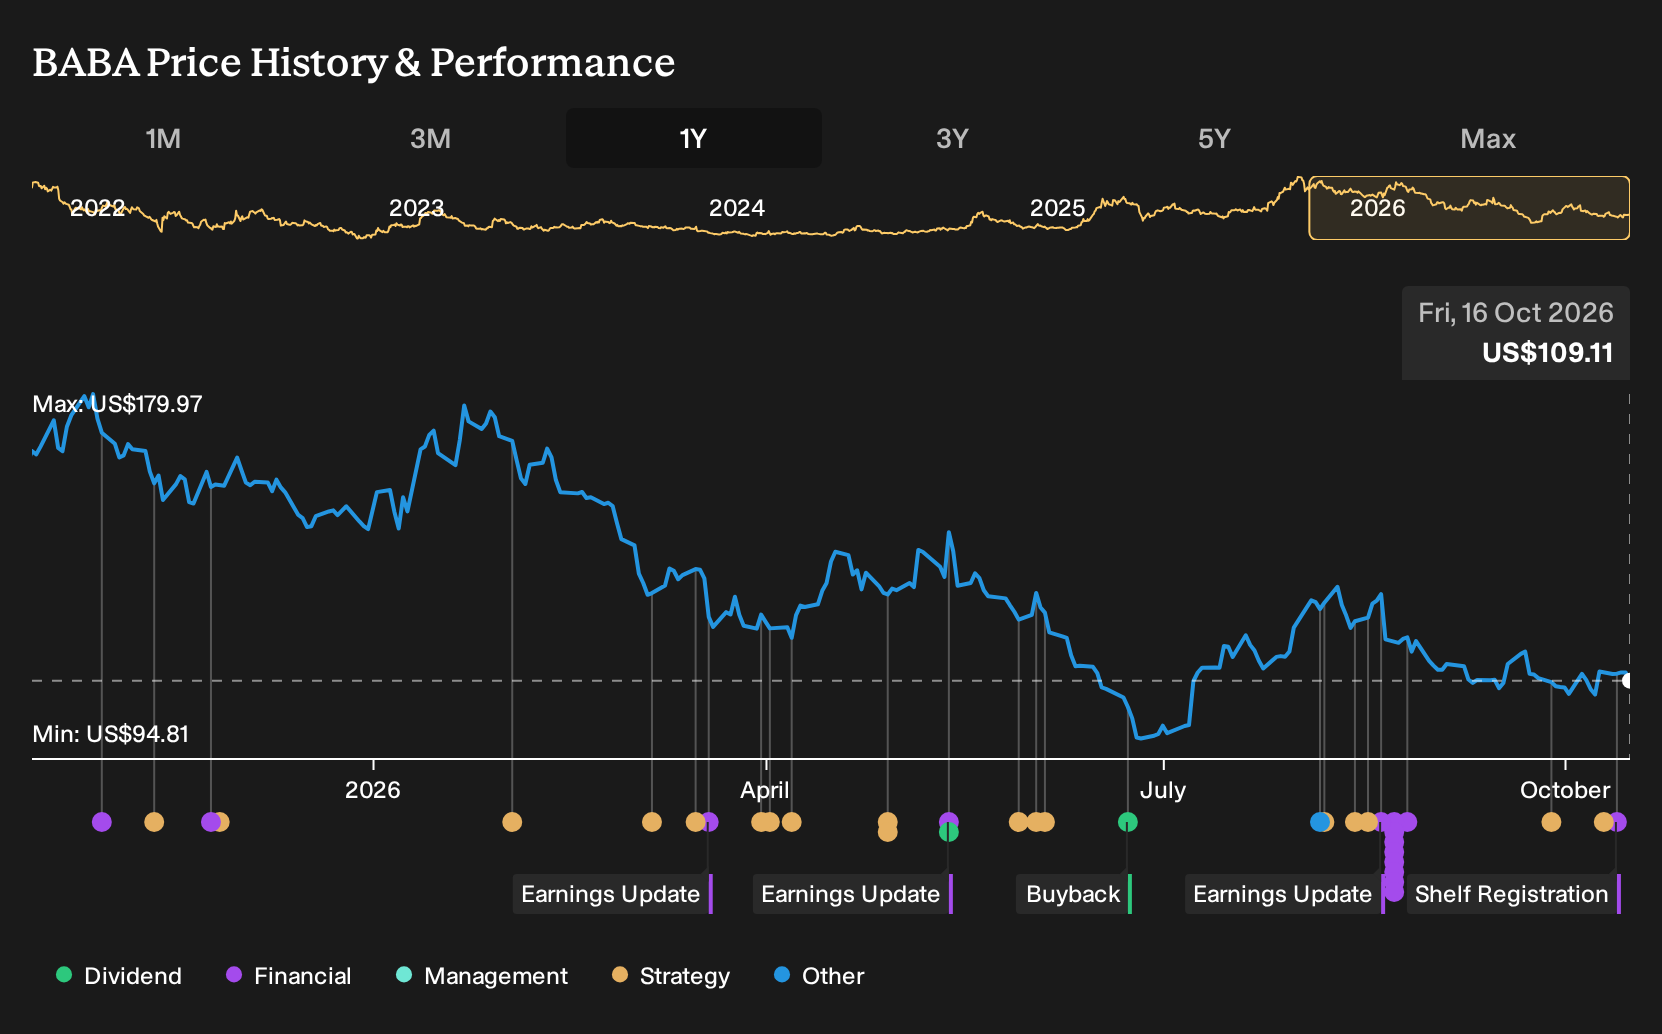
What The Alibaba Evidence Put Under The Microscope
The clearest new fact is Alibaba Group’s AI driven cloud push, backed by a HK$80b Hong Kong share sale and large AI chip and data center plans. This supported the bullish argument on revenue scale. Over the same period, however, there was pressure on earnings. Net income excluding extra items fell from CNY 43,116m to CNY 10,537m and net margin dropped from 17.4% to 3.9%. Overall, the evidence pointed in both positive and negative directions.
The key lesson is straightforward. When an investment case depends on heavy spending that is expected to improve profitability later, it can be useful to track net margin alongside top line figures. For any other stock where management highlights large AI or growth budgets, it can be informative to keep watching whether margins move toward the original thesis or away from it in each set of reported numbers.
What You Would Be Paying For In Alibaba Group Today
Alibaba Group trades at US$109 after a 34.1% loss over the past year, and the selected Narrative’s Fair Value sits above that level. The Narrative argues you are not just paying for Chinese e-commerce at this price.
Its case leans on Alibaba’s wider technology ecosystem. A buyer today would need to judge whether the broader asset base, especially AI and cloud, can justify a higher overall business value.
"Alibaba is one of the few large-cap companies in the world where there appears to be a meaningful gap between market perception and the underlying value of its assets. At current prices, many investors still view Alibaba primarily as a Chinese e-commerce company."
That disagreement has a full argument behind it. → Uncover the higher Fair Value this Narrative argues for
Before The Next Story Makes Headlines
This company's disappointment is already part of the story. Your next idea could come from looking where the price and the possibilities still seem far apart. Here are three companies priced below our estimates.
- Company 1 - 26% below our estimate - sells injectable treatments that reshape how patients manage weight loss and diabetes together.
- Company 2 - 49% below our estimate - expands a digital small business banking platform that ties lending, deposits and payments.
- Company 3 - 23% below our estimate - supplies testing and diagnostic hardware utilities use while upgrading power grids and equipment.
That is three of the list. See every one of the 33 undervalued companies on it →
This article by Simply Wall St is general in nature. We provide commentary based on historical data and analyst forecasts only using an unbiased methodology and our articles are not intended to be financial advice. It does not constitute a recommendation to buy or sell any stock, and does not take account of your objectives, or your financial situation. We aim to bring you long-term focused analysis driven by fundamental data. Note that our analysis may not factor in the latest price-sensitive company announcements or qualitative material. Simply Wall St has no position in any stocks mentioned.
Have feedback on this article? Concerned about the content? Get in touch with us directly. Alternatively, email editorial-team@simplywallst.com