


Q.E.P. (QEPC) Stock Slips After Q2 Earnings Despite Stronger Margins
Q.E.P. just posted its Q2 2027 scorecard, and the stock immediately slipped about 2.5% on the day. That move tells you more about nerves than numbers. Basic earnings per share landed near US$1.97 and quarterly net income came in close to US$5.8 million, hardly the profile of a company in distress.
What traders punished was not a blowup in the figures. The reaction looks like a sentiment squeeze on a consumer durables stock that had already climbed over the past quarter. The actual earnings story revolves around how much profit Q.E.P. is now pulling from each dollar of revenue.
Like Q.E.P’s earnings profile but wary of sentiment swings after a run-up and a 2.5% pullback on the print? Compare this setup with a curated list of consumer and industrial names in our list of solid balance sheet and fundamentals stocks (25 results).
Q2 2027 Earnings Summary
- Revenue (Q2 2027 vs. Q2 2026): US$61.05 million vs. US$57.66 million (higher year on year)
- Net Income, Excl. Extra Items (Q2 2027 vs. Q2 2026): US$5.85 million vs. US$3.54 million (higher year on year)
- Basic EPS (Q2 2027 vs. Q2 2026): US$1.97 vs. US$1.09 (higher year on year)
- Trailing Net Profit Margin (last 12 months vs. prior year): 7.0% vs. 6.7% (modestly stronger profitability)
Tired of squinting at raw Q.E.P figures and scrolling through dense tables of results? Get the full story in a visual format that brings together the company’s valuation picture inside our company report for Q.E.P.
Q.E.P. earnings rhythm supports a cautious bull story
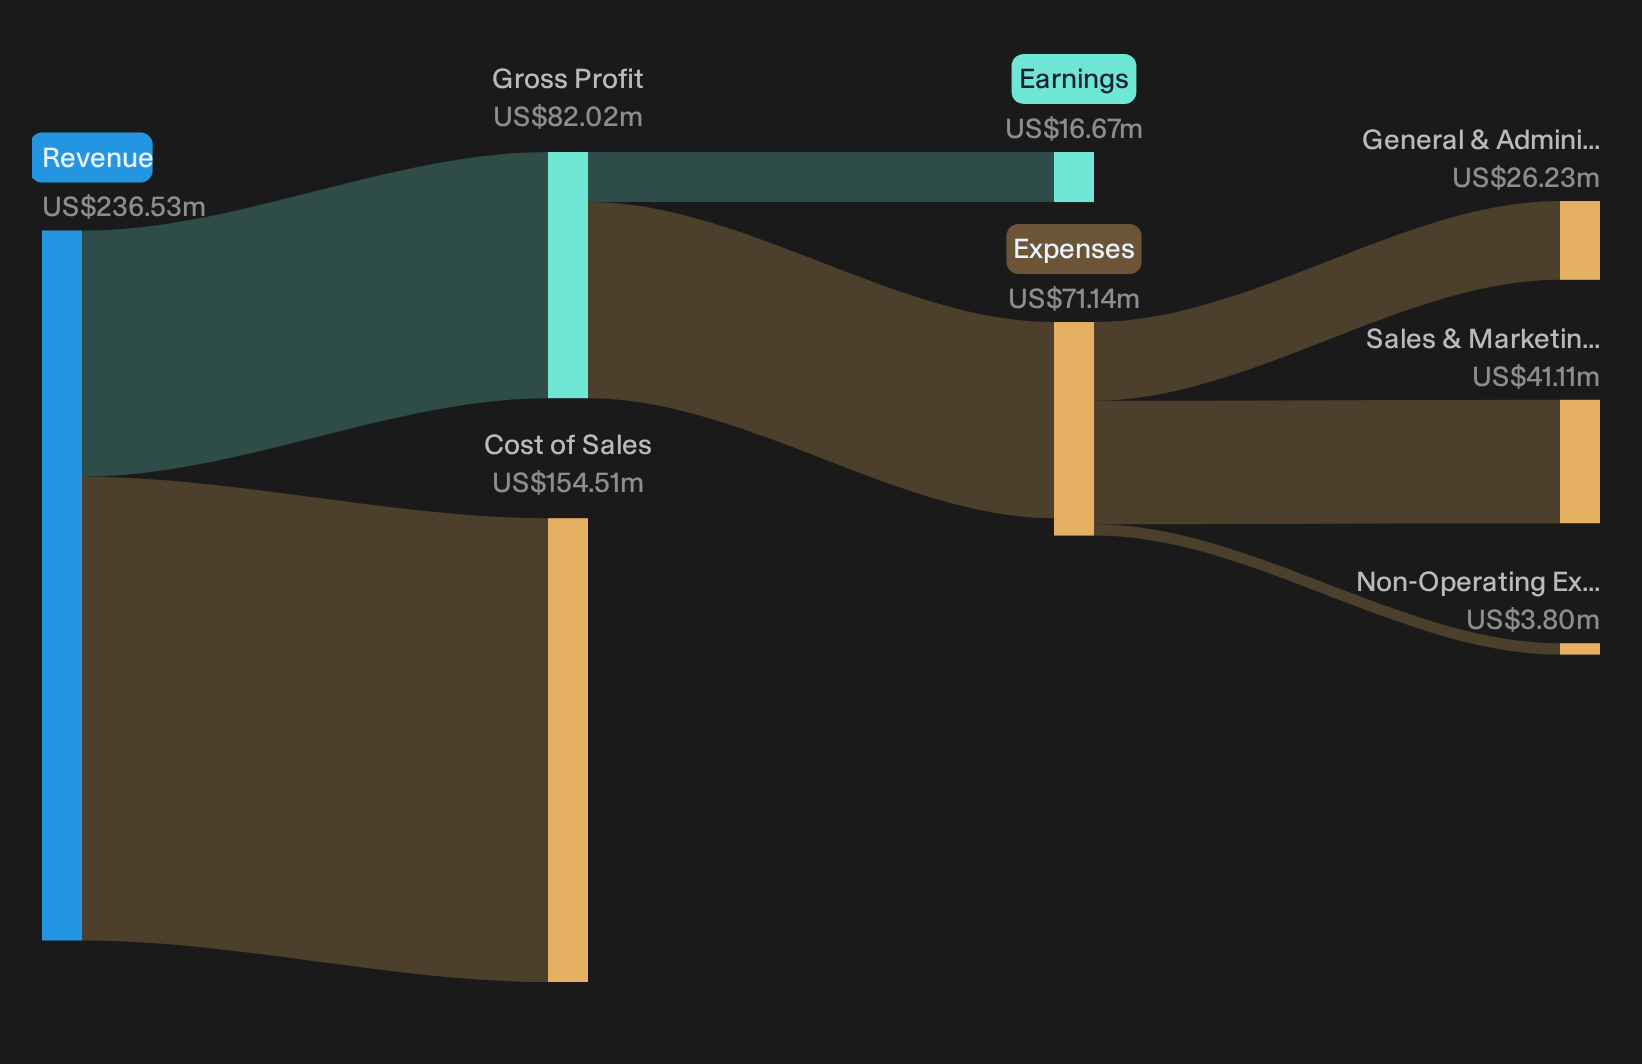
For anyone leaning constructive on Q.E.P., this quarter lines up with that view. Revenue sits at US$61.05 million against US$57.66 million a year earlier, and basic EPS of US$1.97 compares with US$1.09. Trailing net profit margin edges to 7.0% from 6.7%. Those shifts fit a thesis that this flooring tools supplier can grind out higher earnings from its niche. The share price slipped 2.5% on the day, yet the operational picture points to a business that is currently producing more profit from similar end markets.
Short term Q.E.P. risks still revolve around sentiment
Bears worried about fundamental strain get limited backing from these figures. Profitability, measured by trailing net margin at 7.0% versus 6.7%, is not signaling clear deterioration. Net income excluding extra items of US$5.85 million versus US$3.54 million also points away from an immediate earnings air pocket. The pushback instead sits in the tape. The stock has eased 2.5% on the release and is down roughly 1.3% over seven days, which underlines how quickly sentiment can cool after a strong 90 day run of about 15%.
With Q.E.P showing a 7% net margin and a P/E of 10.1x, the real question is how sturdy the balance sheet looks behind those earnings. Check the full solvency and liquidity breakdown in our financial health analysis of Q.E.P stock.Hunt Quiet Disconnects In Plain View
Q.E.P shows how earnings strength and a modest price dip can pull in very different directions. The real opportunity could be spotting stocks that look misaligned before pricing fully reflects their fundamentals.
- Company 1 - 32% below our estimate - builds integrated compute racks and software stacks for data center-scale artificial intelligence workloads.
- Company 2 - 23% below our estimate - supplies advanced grid testing equipment as utilities modernize networks for electrification and aerospace programs.
- Company 3 - 34% below our estimate - expands high horsepower engine capacity to serve long-duration data center power and backup projects.
Three companies from the same screener. Open all 33 potentially undervalued companies →
This article by Simply Wall St is general in nature. We provide commentary based on historical data and analyst forecasts only using an unbiased methodology and our articles are not intended to be financial advice. It does not constitute a recommendation to buy or sell any stock, and does not take account of your objectives, or your financial situation. We aim to bring you long-term focused analysis driven by fundamental data. Note that our analysis may not factor in the latest price-sensitive company announcements or qualitative material. Simply Wall St has no position in any stocks mentioned.
Have feedback on this article? Concerned about the content? Get in touch with us directly. Alternatively, email editorial-team@simplywallst.com