


Why Is Sempra (SRE) Getting A Closer Look Today?
Sempra (SRE) shares last closed at US$81.99 after a mixed recent run, with the stock up over the past week but down over the past month and past 3 months.
Recent trading paints a mixed picture for Sempra. The 7-day share price return of 2.89% offers a short burst of strength after the 90-day share price decline of 11.98%. The 1-year total shareholder return is down 8.48% but remains well ahead on a 3-year and 5-year basis, at 27.91% and 46.08% respectively.
Scan how Sempra stacks up against peers by reviewing a hand picked 32 resilient stocks with low risk scores that share resilient profiles in tougher tape conditions.
Bulls see Sempra as a regulated utility with steady earnings, while bears see a stock that has lagged over 1 year and 90 days. Which story does the valuation actually support next?
Most Popular Narrative: 17% Undervalued
On the most followed narrative, Sempra screens as undervalued, with a fair value of about $99 against the recent $81.99 close. The key question is whether the long term grid and LNG plan actually earns through as expected.
The US$47.5b five year base capital plan at Oncor, along with US$10b of incremental identified projects tied to ERCOT endorsed upgrades, reliability work and future resiliency filings, keeps the earlier thesis about sustained capital deployment into transmission and distribution assets in place as a driver of long term earnings growth.
See why 26 investors see Sempra as 17% undervalued.
Result: Fair Value of $99.03 (UNDERVALUED)
Still, the bullish script for Sempra can falter if Texas regulators tighten allowed returns, or if LNG project delays drag longer than investors currently expect.
Find out about the key risks to this Sempra narrative.
Another View: Sempra Looks Expensive On Earnings
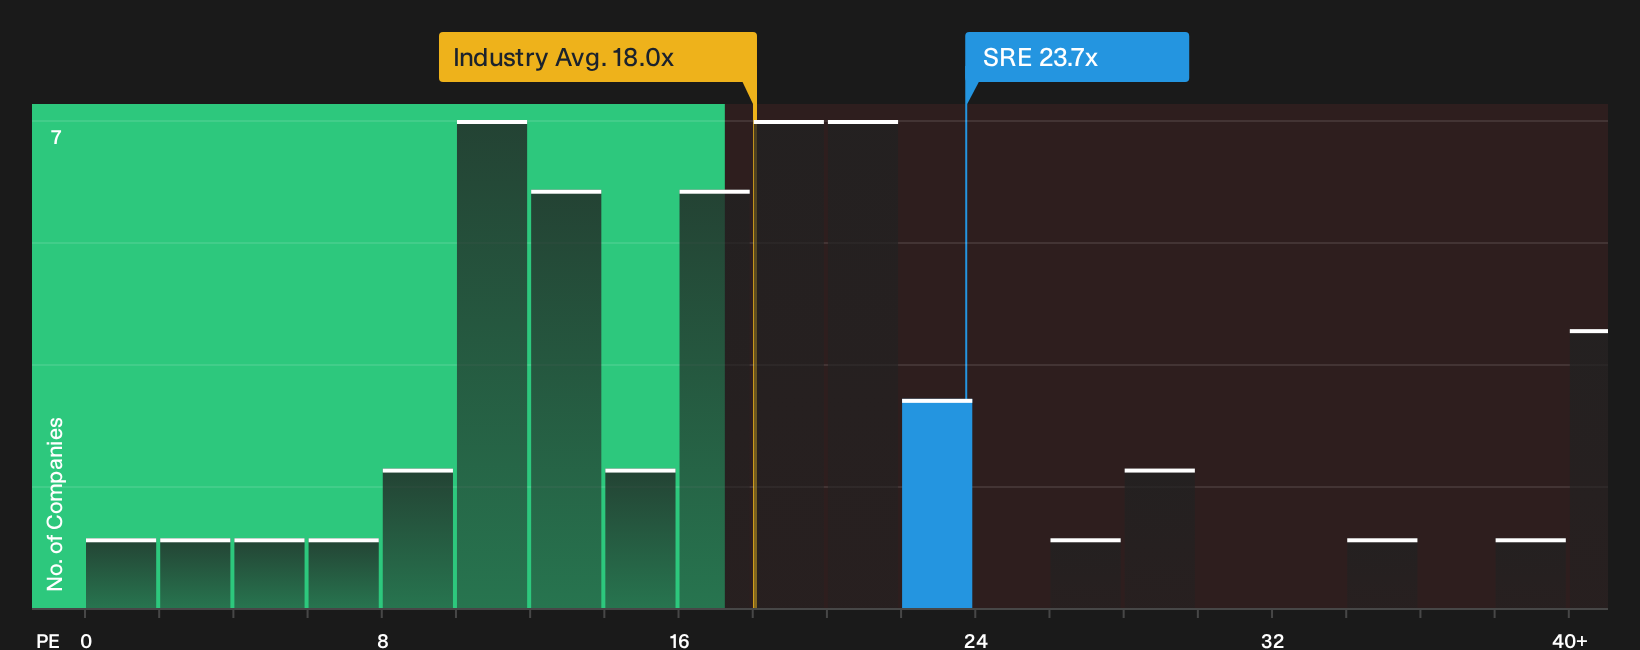
Sempra may screen as undervalued on fair value models, but the simple P/E check points the other way. The stock trades at 23.7x earnings compared with 18x for the global Integrated Utilities group and 19.6x for peers, while the fair ratio sits lower again at 22.5x. That richer multiple leaves less room for error if growth or returns land below expectations.
For investors weighing this higher earnings multiple against the long term grid and LNG story, it can help to see how the numbers stack up in more detail, starting with the See what the numbers say about this price — find out in our valuation breakdown..
Next Steps
That tug of war between underpriced potential and richer earnings multiples puts the burden on you to stress test the story yourself. The quickest way to weigh both sides of the ledger is to review the 1 key reward and 2 important warning signs.
Looking for more investment ideas beyond Sempra?
If the Sempra story has you thinking harder about valuation and risk, use that momentum to widen your watchlist with a few targeted screens right now.
Do not wait for the next headline to push you into action. Start building a stronger opportunity set today with focused filters that match what you actually care about.
- Target potential mispriced opportunities by scanning a hand picked 32 high quality undervalued stocks before others catch on to the same numbers.
- Sharpen your income game by reviewing a curated 7 dividend fortresses that concentrates on higher yields with resilient payout histories.
- Fortify your core holdings by screening a list of solid balance sheet and fundamentals (25 results) so your capital leans toward stronger financial foundations.
This article by Simply Wall St is general in nature. We provide commentary based on historical data and analyst forecasts only using an unbiased methodology and our articles are not intended to be financial advice. It does not constitute a recommendation to buy or sell any stock, and does not take account of your objectives, or your financial situation. We aim to bring you long-term focused analysis driven by fundamental data. Note that our analysis may not factor in the latest price-sensitive company announcements or qualitative material. Simply Wall St has no position in any stocks mentioned.
Have feedback on this article? Concerned about the content? Get in touch with us directly. Alternatively, email editorial-team@simplywallst.com