


GDEP ADVANCEInc (TSE:5885) Stock Cools As Earnings Power Jumps
GDEP ADVANCEInc comes into this earnings release with a stock that has cooled in the short term. The share price is down about 1.8% over the past week and roughly 4.6% over the past month, even though the 90 day move is still positive.
The headline this quarter is profits. Q1 2027 basic earnings per share of ¥49.84 on revenue of ¥1,541 million mark a strong step up from recent quarters and feed into trailing 12 month earnings growth of 65.4%. For investors with a longer lens, that jump in profitability sits against a P/E of 17.5x that already prices in a lot of good news.
Is GDEP ADVANCEInc now priced for perfection or already stretching its fundamentals? Compare the current ¥2,942 share price against our detailed cash flow and multiples workup on the valuation analysis for GDEP ADVANCEInc.Q1 2027 Earnings Summary
- Revenue (Q1 2027 vs Q1 2026): ¥1,541 million vs. ¥948.848 million (higher year on year)
- Net Income (Excl. Extra Items, Q1 2027 vs Q1 2026): ¥274 million vs. ¥135.746 million (higher year on year)
- Basic EPS (Q1 2027 vs Q1 2026): ¥49.84 vs. ¥25.06 (higher year on year)
- Trailing 12 Month Net Income (Excl. Extra Items, Q1 2027 vs Q1 2026): ¥924.254 million vs. ¥558.674 million (higher over the past year)
Prefer clean charts over dense tables of figures and footnotes? Get a full visual read on GDEP ADVANCEInc, including how the recent earnings feed into its valuation profile, in the company report for GDEP ADVANCEInc.
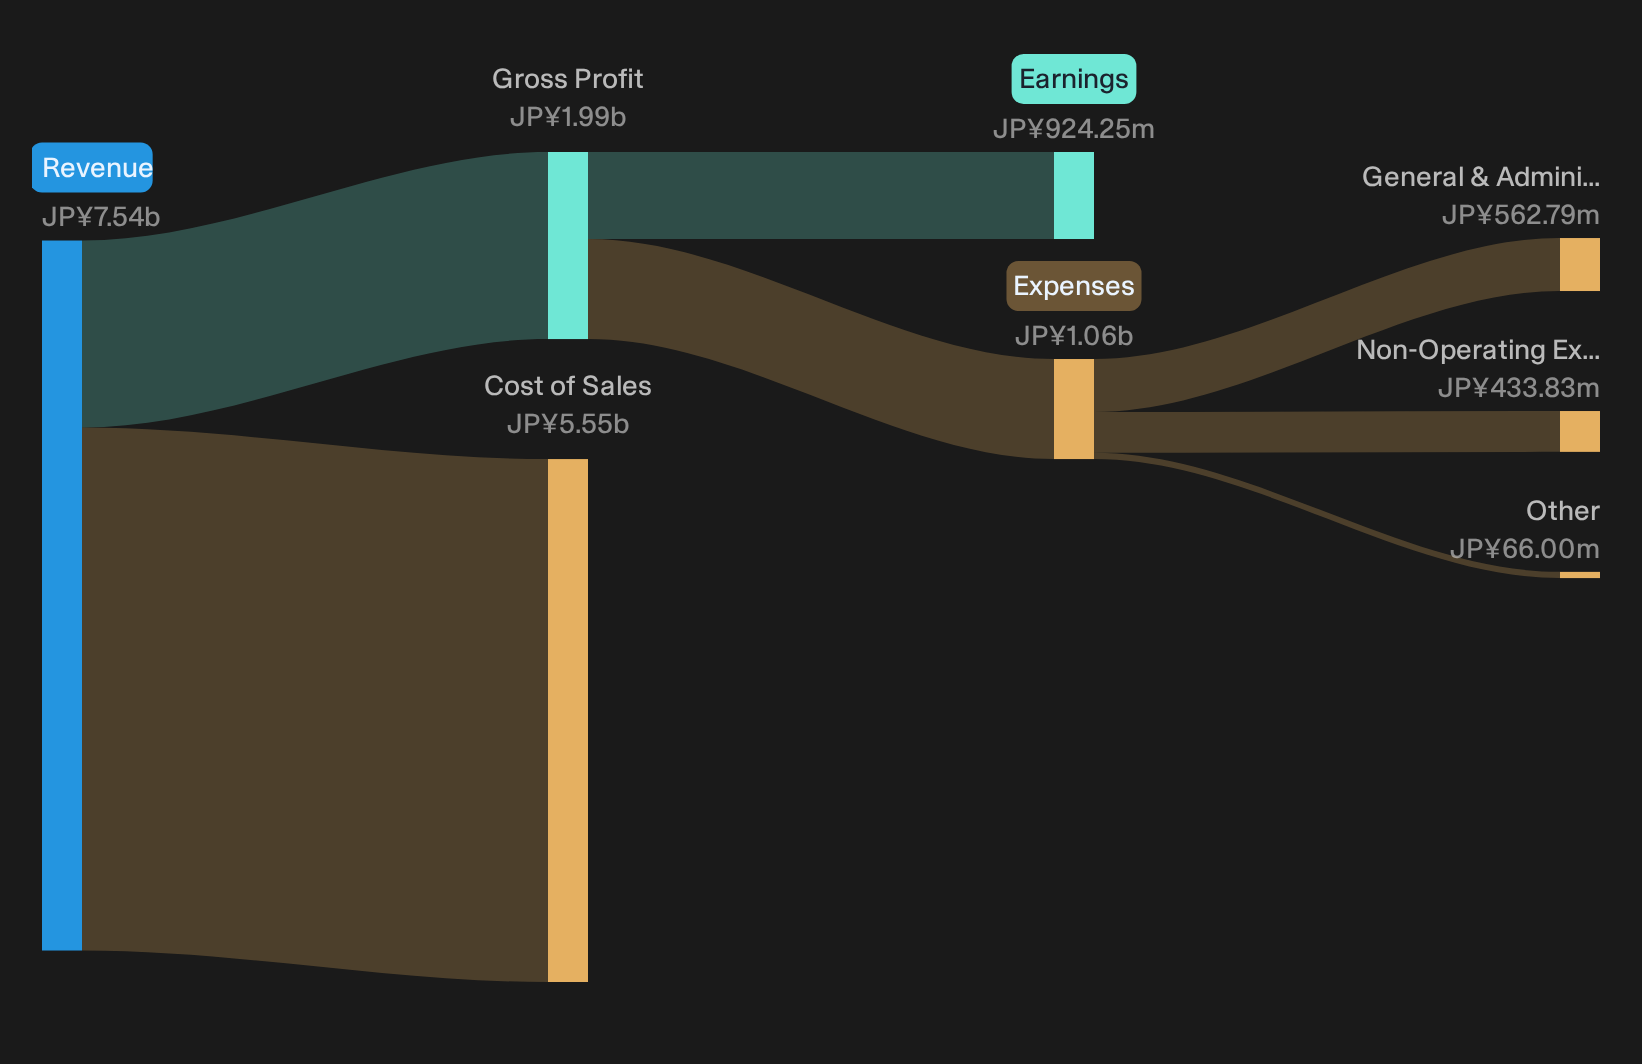
Profits Give GDEP ADVANCE Bull Case Real Earnings Fuel
For anyone leaning positive on GDEP ADVANCE, this quarter’s direction helps. Revenue of ¥1,541 million and net income of ¥274 million are both higher than a year ago, and basic EPS almost doubles to ¥49.84. Trailing 12 month earnings growth of 65.4% suggests the AI and GPU infrastructure story is at least translating into fatter profits. Share performance has cooled over 7 and 30 days, yet the 90 day gain stays positive, so recent weakness looks more like a pause rather than a collapse in confidence.
Short‑Term Share Weakness Keeps GDEP ADVANCE Risks In View
The bearish angle does not disappear. The stock is down about 1.8% over the past week and roughly 4.6% over the past month, which indicates that some holders are questioning how durable this earnings jump is. GDEP ADVANCE also operates in hardware linked to big vendor cycles and budgets, so cyclicality risk lingers even when profits are rising. That said, higher net income and EPS reduce the argument that the business model is stalling right now, and they temper the harshest near term worries.
After a quarter like this, short term volatility may be the first warning sign rather than the whole story. Review our independent risk analysis for GDEP ADVANCEInc which shows 1 important warning signStay Ahead Of Your Next Move
If GDEP ADVANCEInc's sharp Q1 2027 earnings step up has your attention, register for free with Simply Wall St and add it to a Watchlist so you can track the share price against fair value and wait for a setup that fits your plan. Once you hold the stock, use the Portfolio Command Center to cut through noise and focus on the key financial and valuation updates that matter to your returns. For longer term thinking, tap into the Community to see how other investors are interpreting the same numbers and news. Spot potential catalysts and risks early, keep context around every move, and give yourself the opportunity to stay a step ahead of the wider market.
Seeking Alternatives Beyond GDEP ADVANCEInc?
Fresh ideas move first. Stocks starting a breakout or building momentum often fly before most investors notice. Check under the radar for now and act now.
- Chase resilient cash flows and sturdy balance sheets with a curated list of solid balance sheet and fundamentals stocks (21 results) that keeps you focused on businesses built to handle rough patches.
- Spot potential income engines by scanning 31 dividend fortresses. This aims to balance higher yields with businesses focused on sustaining those payouts while it still matters.
- Track early movers in digital assets through 18 cryptocurrency and blockchain stocks before the crowd catches every headline and pushes attention away from quieter, earlier entry points.
This article by Simply Wall St is general in nature. We provide commentary based on historical data and analyst forecasts only using an unbiased methodology and our articles are not intended to be financial advice. It does not constitute a recommendation to buy or sell any stock, and does not take account of your objectives, or your financial situation. We aim to bring you long-term focused analysis driven by fundamental data. Note that our analysis may not factor in the latest price-sensitive company announcements or qualitative material. Simply Wall St has no position in any stocks mentioned.
Have feedback on this article? Concerned about the content? Get in touch with us directly. Alternatively, email editorial-team@simplywallst.com