


GBPUSD Flashback: The Chart I Shared on October 6 and What Happened Next
Good day to everyone! Since cable is in focus this morning, I wanted to go back to a chart I shared on October 6, because it shows nicely what I was looking at then.
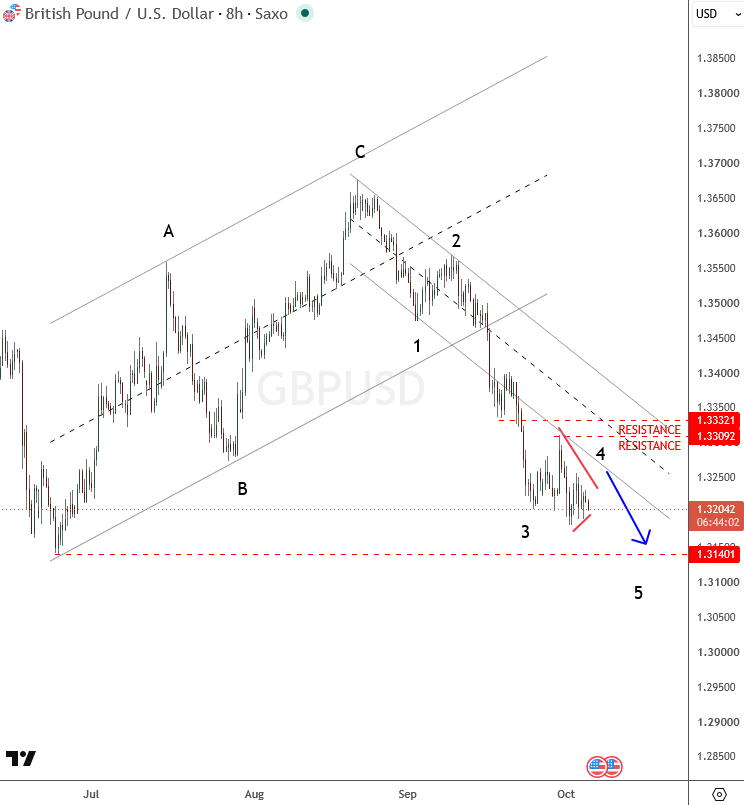
Back then, cable was in a clear bearish structure. Price had broken out of the channel it was trading in since the summer, and I was counting a small wave 4 bounce, with resistance around 1.3310 and 1.3330. After that, I expected wave 5 lower, with the 2026 low at 1.3140 as the first target. As I put it at the time, it looked like a clear pattern that could retest that low.
Fast forward to this week. The bounce stayed below resistance, and then price dropped to 1.3140, almost exactly where the chart pointed. It then moved back up to around 1.3240.
If you like seeing Elliott Wave charts like this before the move happens, our first month of full access is just €20.
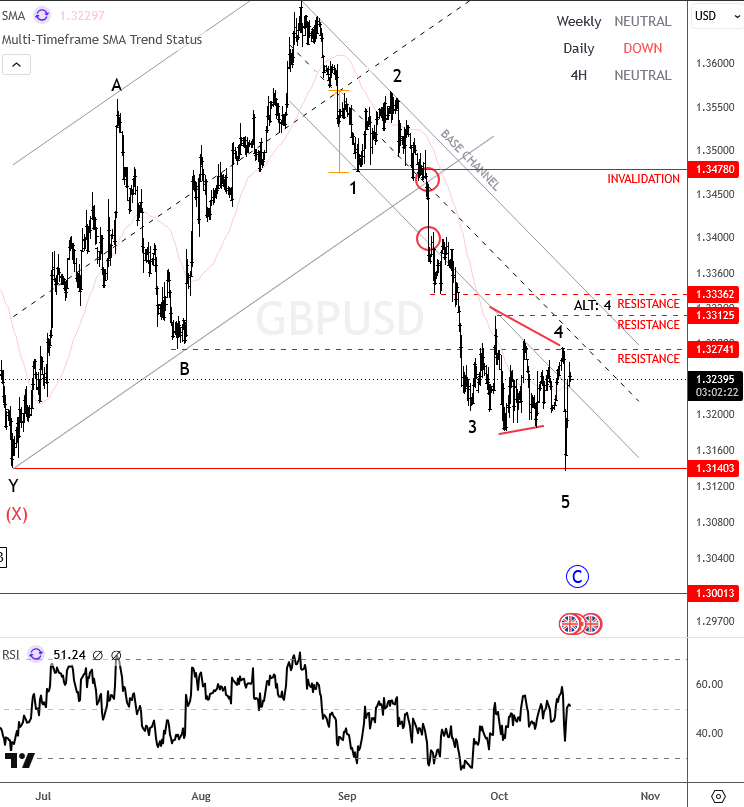
So what now? The picture is still simple for me. As long as price stays below 1.3300/30, the trend is down, and I will not turn bullish. The bounce can be a short pause before another leg lower, or the spike to 1.3140 may have already finished the whole move. I do not need to guess. If cable fails near 1.3300/30, I expect another test of 1.3140, then 1.3000. A move above 1.3336 would make me step back and re-think the count, and above 1.3478 the bearish view is invalid.
The next trigger is inflation. Hot US CPI helped push cable to the low yesterday, and UK CPI follows on Wednesday, October 21, at 7:00 a.m. UK time. I will be watching how price reacts around those levels.
Trade well,
Grega