


3 Asian Stocks Estimated To Be Trading At A Discount Of Up To 41.3%
Amidst the backdrop of volatile energy prices and geopolitical tensions, Asian markets have shown resilience, with indices reflecting mixed performances across the region. In this environment, identifying undervalued stocks can be crucial for investors seeking opportunities; these stocks often present potential value when trading below their intrinsic worth due to market inefficiencies or temporary setbacks.
Top 10 Undervalued Stocks Based On Cash Flows In Asia
| Name | Current Price | Fair Value (Est) | Discount (Est) |
| TOKAI (TSE:9729) | ¥2575.00 | ¥5037.09 | 48.9% |
| Riken Technos (TSE:4220) | ¥2446.00 | ¥4768.79 | 48.7% |
| Nissui (TSE:1332) | ¥1080.00 | ¥2141.38 | 49.6% |
| Monde Nissin (PSE:MONDE) | ₱6.35 | ₱12.68 | 49.9% |
| Marco Polo Marine (SGX:5LY) | SGD0.119 | SGD0.23 | 48.9% |
| Kumagai GumiLtd (TSE:1861) | ¥1203.00 | ¥2380.29 | 49.5% |
| Innocean Worldwide (KOSE:A214320) | ₩18010.00 | ₩35939.95 | 49.9% |
| Inner Mongolia ERDOS ResourcesLtd (SHSE:600295) | CN¥14.34 | CN¥28.17 | 49.1% |
| Astellas Pharma (TSE:4503) | ¥2262.50 | ¥4494.42 | 49.7% |
| ARE Holdings (TSE:5857) | ¥3445.00 | ¥6698.35 | 48.6% |
Underneath we present a selection of stocks filtered out by our screen.
Systena (TSE:2317)
Overview: Systena Corporation operates in Japan, focusing on solution and framework design, IT services, business solutions, and cloud businesses with a market cap of ¥156.21 billion.
Operations: Systena's revenue is derived from its operations in solution and framework design, IT services, business solutions, and cloud businesses within Japan.
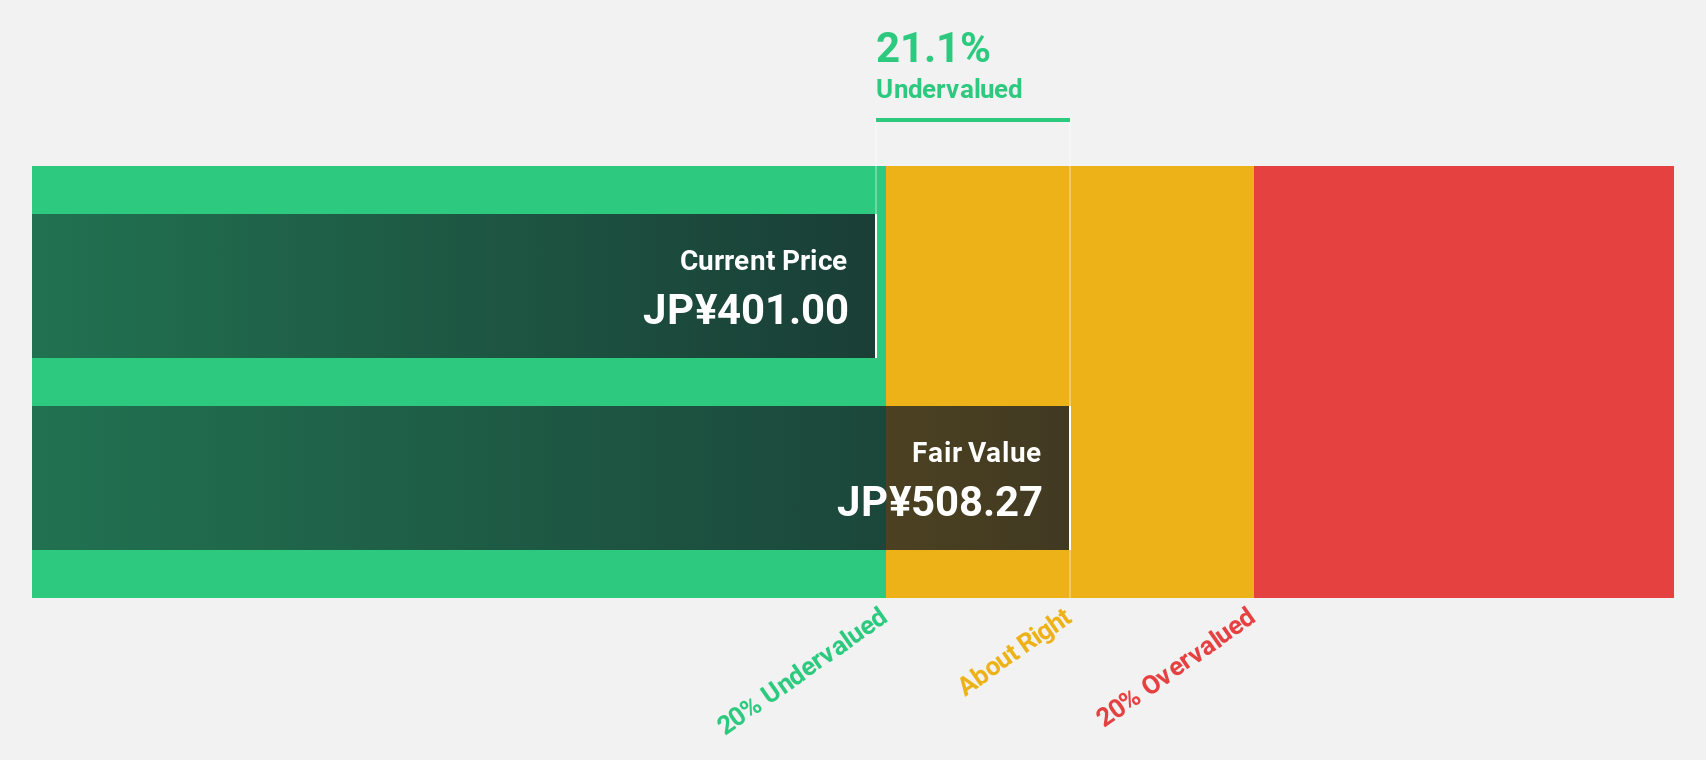
Estimated Discount To Fair Value: 34.9%
Systena Corporation is trading at ¥437, below its estimated future cash flow value of ¥671.56, indicating it may be undervalued based on cash flows. The stock trades 34.9% below its fair value estimate and offers a reliable dividend yield of 4.12%. While earnings are forecast to grow at 4.89% annually, slower than the broader Japanese market, the company's return on equity is expected to reach a robust 26.4% in three years.
- The growth report we've compiled suggests that Systena's future prospects could be on the up.
- Unlock comprehensive insights into our analysis of Systena stock in this financial health report.
CyberAgent (TSE:4751)
Overview: CyberAgent, Inc., along with its subsidiaries, operates in the internet advertising sector in Japan and has a market capitalization of approximately ¥640.76 billion.
Operations: The company's revenue is primarily derived from its Internet Advertisement segment at ¥478.16 billion, followed by Game at ¥269.74 billion and Media & IP at ¥246.56 billion, with a smaller contribution from Investment Development amounting to ¥471 million.
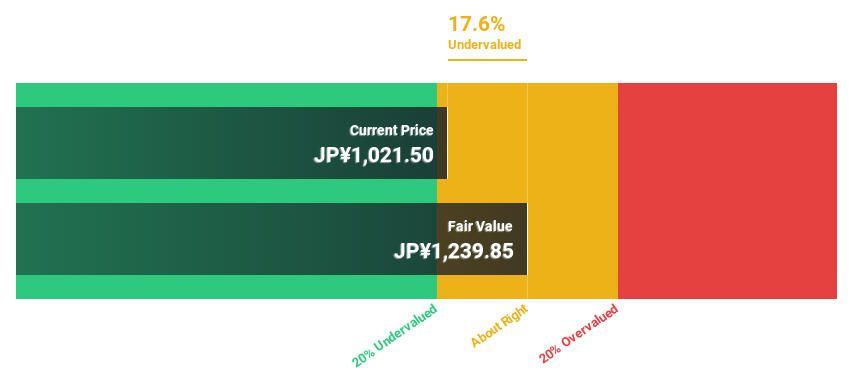
Estimated Discount To Fair Value: 20.2%
CyberAgent is trading 20.2% below its fair value estimate, reflecting potential undervaluation based on cash flows. The company's recent upward revision of earnings guidance for fiscal year 2026 highlights robust performance in key sectors, with net income now expected at ¥41 billion. Despite high share price volatility, analysts anticipate a 42.6% rise in stock price, supported by forecasted annual earnings growth of 9.7%, surpassing the Japanese market average.
- Upon reviewing our latest growth report, CyberAgent's projected financial performance appears quite optimistic.
- Dive into the specifics of CyberAgent here with our thorough financial health report.
Hamakyorex (TSE:9037)
Overview: Hamakyorex Co., Ltd. offers third-party logistics and truck transportation services both in Japan and internationally, with a market cap of ¥137.84 billion.
Operations: The company generates revenue primarily from its 3PL logistics and truck transportation services in both domestic and international markets.
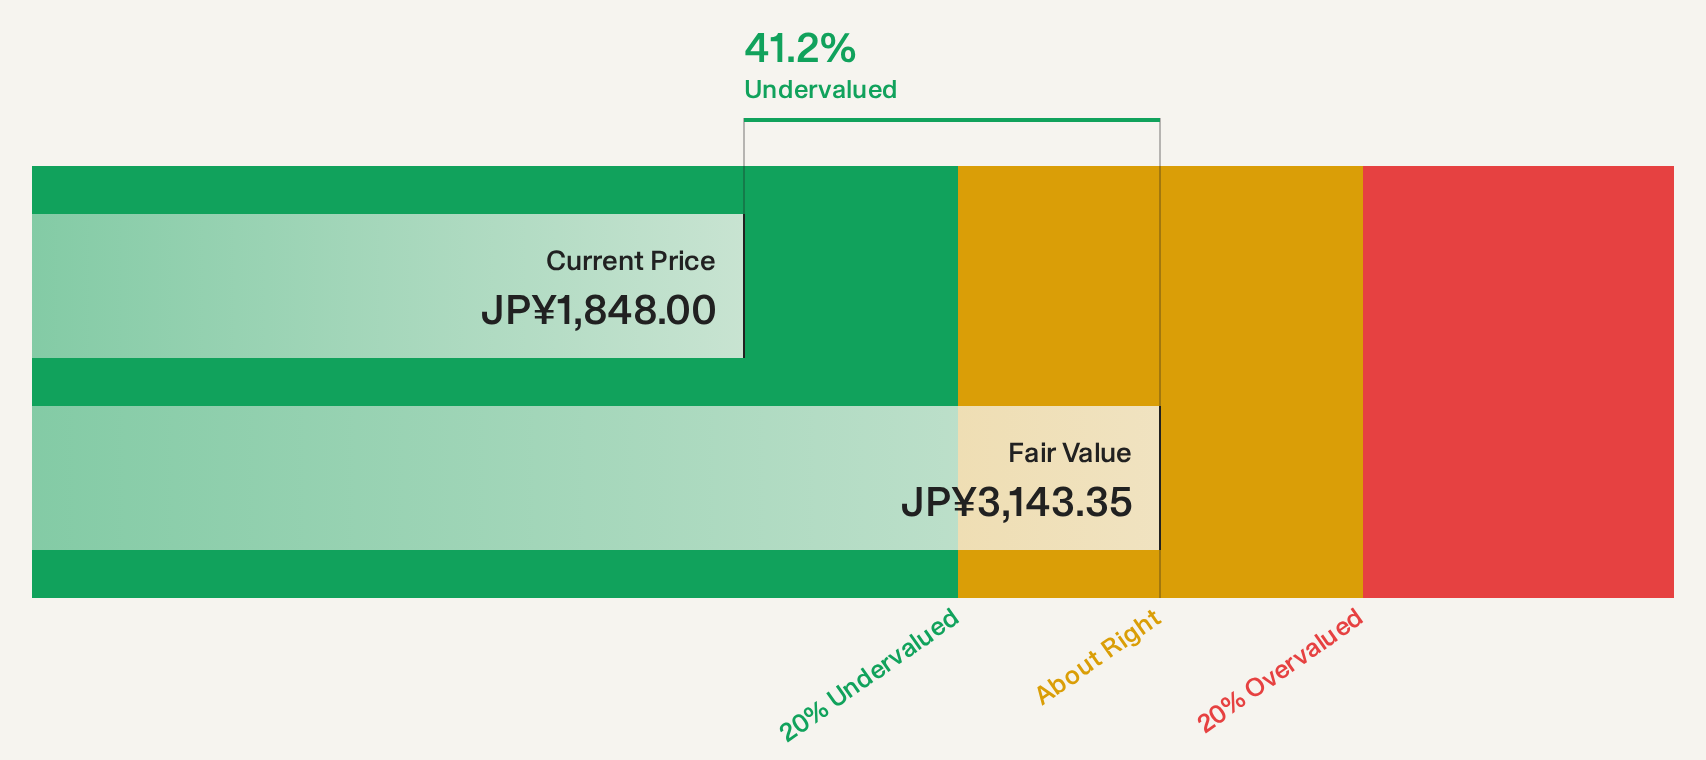
Estimated Discount To Fair Value: 41.3%
Hamakyorex is trading at ¥1,862, significantly below its estimated future cash flow value of ¥3,171.38, indicating undervaluation. The company offers a reliable dividend yield of 2.47% and trades at a good value compared to peers and industry standards. However, its forecasted revenue growth of 5.8% per year and earnings growth of 4.4% per year lag behind the Japanese market averages of 6.8% and 9.6%, respectively.
- Insights from our recent growth report point to a promising forecast for Hamakyorex's business outlook.
- Click here to discover the nuances of Hamakyorex with our detailed financial health report.
Key Takeaways
- Click here to access our complete index of 178 Undervalued Asian Stocks Based On Cash Flows.
- Already own these companies? Bring clarity to your investment decisions by linking up your portfolio with Simply Wall St, where you can monitor all the vital signs of your stocks effortlessly.
- Enhance your investing ability with the Simply Wall St app and enjoy free access to essential market intelligence spanning every continent.
Contemplating Other Strategies?
- Explore high-performing small cap companies that haven't yet garnered significant analyst attention.
- Diversify your portfolio with solid dividend payers offering reliable income streams to weather potential market turbulence.
- Fuel your portfolio with companies showing strong growth potential, backed by optimistic outlooks both from analysts and management.
This article by Simply Wall St is general in nature. We provide commentary based on historical data and analyst forecasts only using an unbiased methodology and our articles are not intended to be financial advice. It does not constitute a recommendation to buy or sell any stock, and does not take account of your objectives, or your financial situation. We aim to bring you long-term focused analysis driven by fundamental data. Note that our analysis may not factor in the latest price-sensitive company announcements or qualitative material. Simply Wall St has no position in any stocks mentioned.
Have feedback on this article? Concerned about the content? Get in touch with us directly. Alternatively, email editorial-team@simplywallst.com