


Rohto PharmaceuticalLtd (TSE:4527) Lifts 2031 Outlook As Valuation Still Looks In Focus
Rohto Pharmaceutical Ltd (TSE:4527) has updated its long-term roadmap, raising its fiscal 2031 guidance to ¥444.0b in sales and ¥56.8b in operating profit, with an operating margin outlook of 13.0%.
Rohto PharmaceuticalLtd shares have climbed over the past year, with a 90 day share price return of 16.34% and a 1 year total shareholder return of 19.08%, suggesting the upgraded long term roadmap is feeding into stronger momentum, despite a softer 1 month share price move of 1.43%.
Scan how Rohto PharmaceuticalLtd’s refreshed long term roadmap compares with other hand picked consumer and healthcare stocks with list of solid balance sheet and fundamentals (21 results)
Rohto PharmaceuticalLtd now pairs a refreshed long term roadmap with a share price that has already moved higher over the past year. The real tension is whether that stronger story is already fully reflected in the price.
Preferred multiple of 19.3x P/E: Is it justified?
Rohto PharmaceuticalLtd is currently valued on a P/E of 19.3x, while Simply Wall St estimates a fair P/E closer to 26.2x, which points to a gap between the current ¥2,830 share price and what the regression based fair ratio implies.
The P/E ratio compares the ¥2,830 price to the earnings generated per share and gives you a quick sense of how much you are paying for each unit of profit. For a business like Rohto PharmaceuticalLtd that operates across eye care, skincare, OTC medicines and functional foods, earnings based metrics often get more attention than pure revenue multiples.
The 19.3x P/E sits below both the peer average of 25x and the estimated fair P/E of 26.2x, which are much richer levels. The market is effectively assigning Rohto PharmaceuticalLtd a discount to both similar personal products stocks and the level the fair ratio model suggests the valuation could move toward if sentiment and assumptions align more closely with peers.
Explore the SWS fair ratio for Rohto PharmaceuticalLtd.
Result: Price-to-earnings of 19.3x (UNDERVALUED)
Still, the Rohto PharmaceuticalLtd story can be knocked off course if its recent annual revenue and net income growth rates of 4.58% and 5.99% cool, or if the weaker 3 year total return of 13.79% signals investor patience thinning.
Find out about the key risks to this Rohto PharmaceuticalLtd narrative.
Another view on Rohto PharmaceuticalLtd’s value
The multiple argument paints Rohto PharmaceuticalLtd as undervalued, yet the SWS DCF model goes further. On this lens, the current ¥2,830 price sits below an estimated future cash flow value of ¥4,601.46, which flags a much wider valuation gap. That raises a sharper question: Which signal do you trust more, earnings or cash flows?
Look into how the SWS DCF model arrives at its fair value.
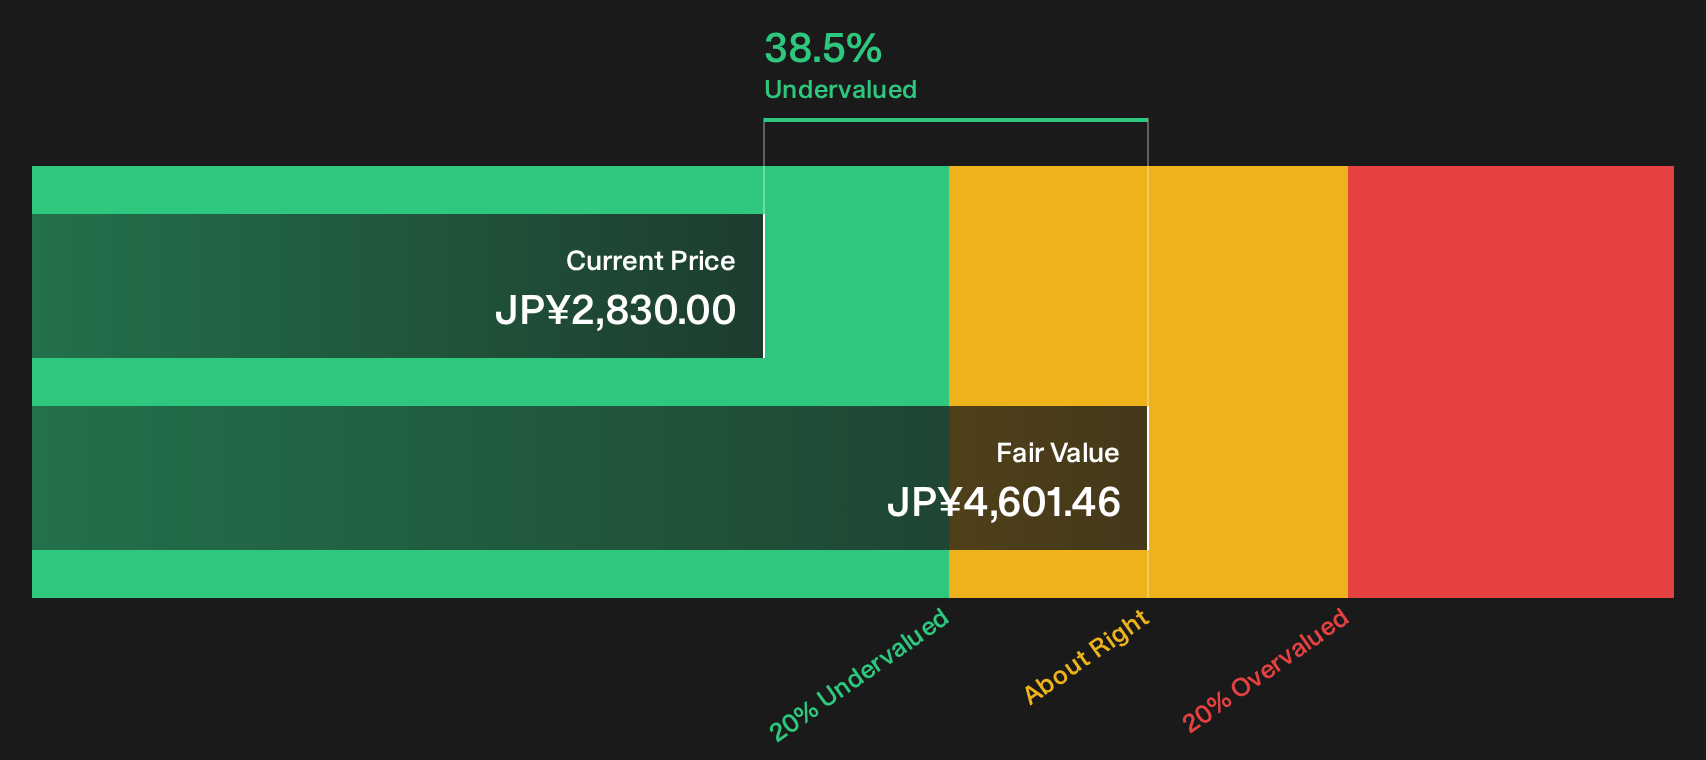
Simply Wall St performs a discounted cash flow (DCF) on every stock in the world every day (check out Rohto PharmaceuticalLtd for example). We show the entire calculation in full. You can track the result in your watchlist or portfolio and be alerted when this changes, or use our stock screener to discover 15 high quality undervalued stocks. If you save a screener we even alert you when new companies match - so you never miss a potential opportunity.
Next Steps
Opinions are mixed on whether Rohto PharmaceuticalLtd’s upgraded roadmap and valuation signals are enough to act on today. Use the data, weigh both the potential upside and the key concerns, and stress test your own thesis with the 2 key rewards and 2 important warning signs
Looking for more investment ideas beyond Rohto PharmaceuticalLtd?
If Rohto PharmaceuticalLtd has sharpened your focus on valuation and quality, do not stop here. Broaden your watchlist with ideas filtered by balance sheet strength, income potential, and under the radar fundamentals so you are not relying on a single story.
- Target robust balance sheets and cleaner fundamentals by scanning companies in the list of solid balance sheet and fundamentals (21 results).
- Hunt for potential value offsets to Rohto PharmaceuticalLtd by reviewing 15 high quality undervalued stocks that pass tight quality filters.
- Build a steadier income stream by checking out 28 dividend fortresses that focus on higher yields with an emphasis on resilience.
This article by Simply Wall St is general in nature. We provide commentary based on historical data and analyst forecasts only using an unbiased methodology and our articles are not intended to be financial advice. It does not constitute a recommendation to buy or sell any stock, and does not take account of your objectives, or your financial situation. We aim to bring you long-term focused analysis driven by fundamental data. Note that our analysis may not factor in the latest price-sensitive company announcements or qualitative material. Simply Wall St has no position in any stocks mentioned.
Have feedback on this article? Concerned about the content? Get in touch with us directly. Alternatively, email editorial-team@simplywallst.com